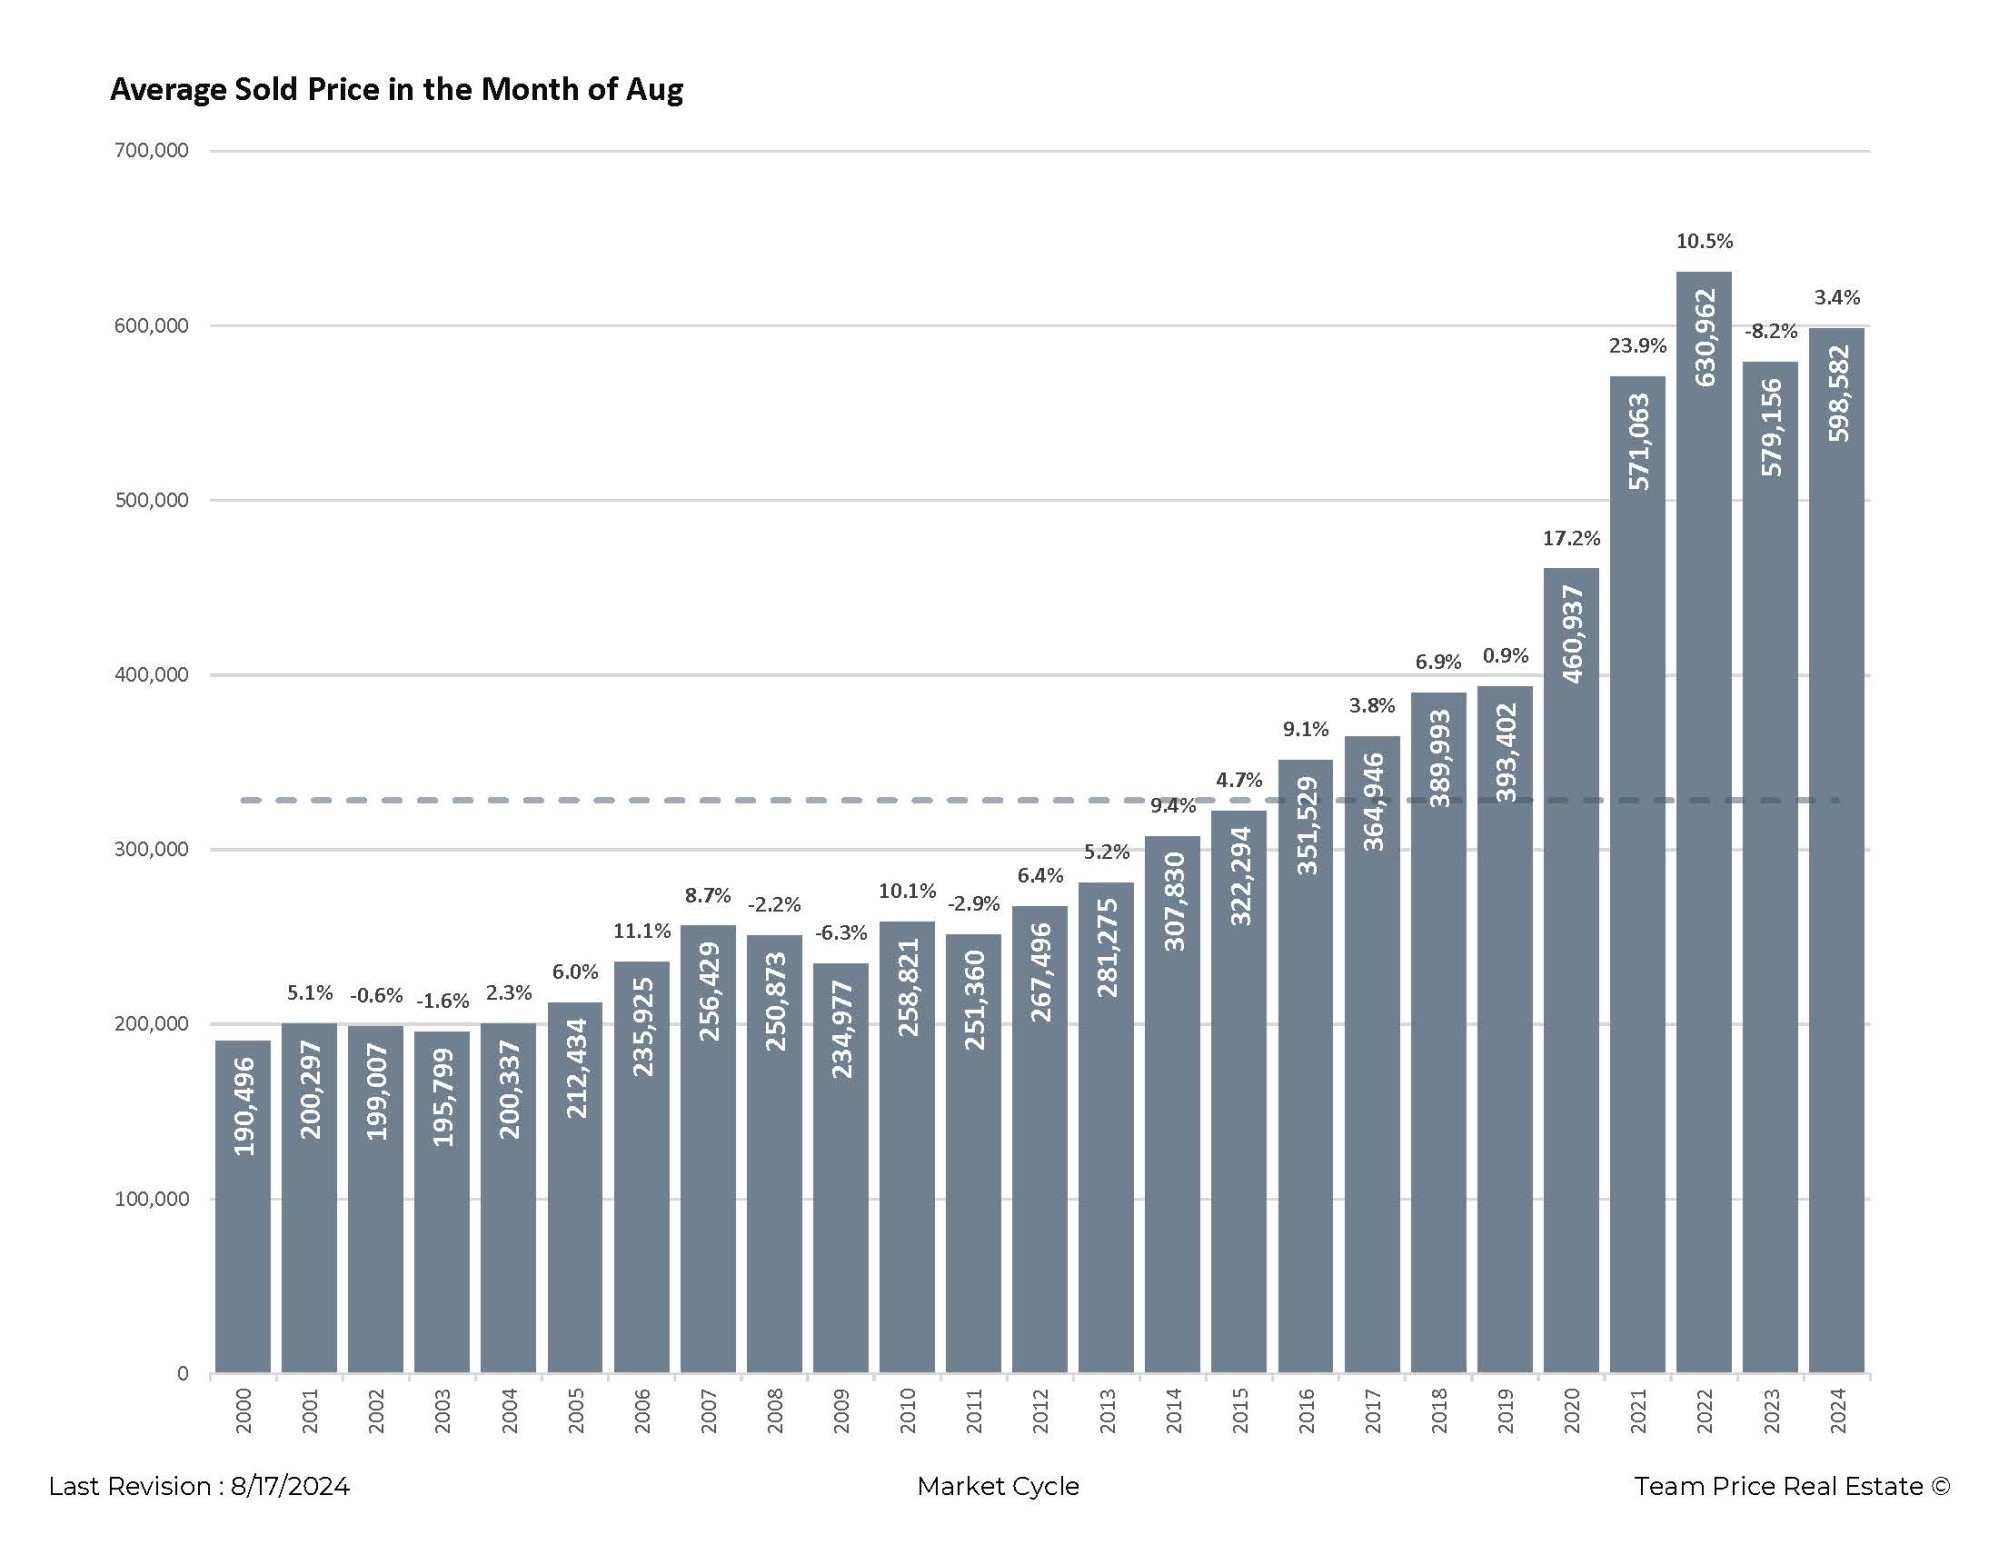
Austin-Area Real Estate Trends: August Home Prices from 2000 to 2024
August 18,2024:Over the past two decades, the Austin-area real estate market has experienced significant changes in average sold prices, particularly during the month of August. Analyzing data from 2000 to 2024 reveals the dynamic nature of this market, reflecting broader economic trends and local factors specific to the Austin Metropolitan Statistical Area (MSA).
In August 2000, the average sold price for homes in the Austin area was approximately $190,496. This period marked the beginning of a steady upward trend in the local real estate market. By August 2004, the average price had increased to $200,297, showcasing consistent growth fueled by Austin's booming economy and population influx, which drove housing demand.
However, this growth was not linear. For example, in 2002, the average sold price slightly declined to $199,007, reflecting a 0.6% decrease from the previous year. Such fluctuations were common and could be attributed to various factors, including changes in interest rates, shifts in local economic conditions, and adjustments in buyer behavior.
The years between 2006 and 2008 were particularly noteworthy in the Austin-area real estate market. In 2006, the average sold price peaked at $235,925, but by 2008, it had decreased to $212,434, marking a 10.1% decline. This period coincided with the national housing market crash, which had significant repercussions even in robust markets like Austin. The decline was a result of the broader economic downturn, which impacted housing prices across the country.
Despite this setback, the Austin-area market demonstrated resilience. Starting in 2009, average sold prices began to recover. By August 2013, the average price had climbed to $258,821, reflecting a strong 10.5% increase from the previous year. This recovery continued as Austin’s economy grew stronger, attracting more residents and businesses to the area, which in turn drove housing demand.
The most recent data, from 2020 to 2024, highlights continued volatility in the Austin real estate market. In August 2020, the average sold price reached $579,156, reflecting a significant rise due to factors such as low interest rates and the growing appeal of Austin as a desirable place to live during the pandemic. However, in 2021, the average price dipped to $557,106, a 3.8% decrease. By 2024, prices had rebounded to $598,582, illustrating the complex interplay of local economic conditions, population growth, and housing supply constraints.
Throughout this 24-year period, the Austin-area real estate market has shown both periods of rapid growth and temporary declines. The data underscores the importance of understanding local market conditions, which can differ significantly from national trends. The resilience of the Austin housing market reflects the region’s ongoing appeal, driven by economic opportunities, quality of life, and a thriving cultural scene.
In conclusion, the average sold prices in August within the Austin MSA from 2000 to 2024 reveal the dynamic and evolving nature of the local real estate market. These prices, influenced by both local and national factors, highlight the importance of monitoring market trends for anyone involved in buying, selling, or investing in Austin-area real estate. As the market continues to evolve, keeping track of these trends will be essential for making informed decisions in this rapidly growing region.


