

Austin Active Housing Market: Days on Market and Listings for March 2025
Published | Posted by Dan Price
A Deep Dive into Austin’s Active Housing Market on March 13, 2025
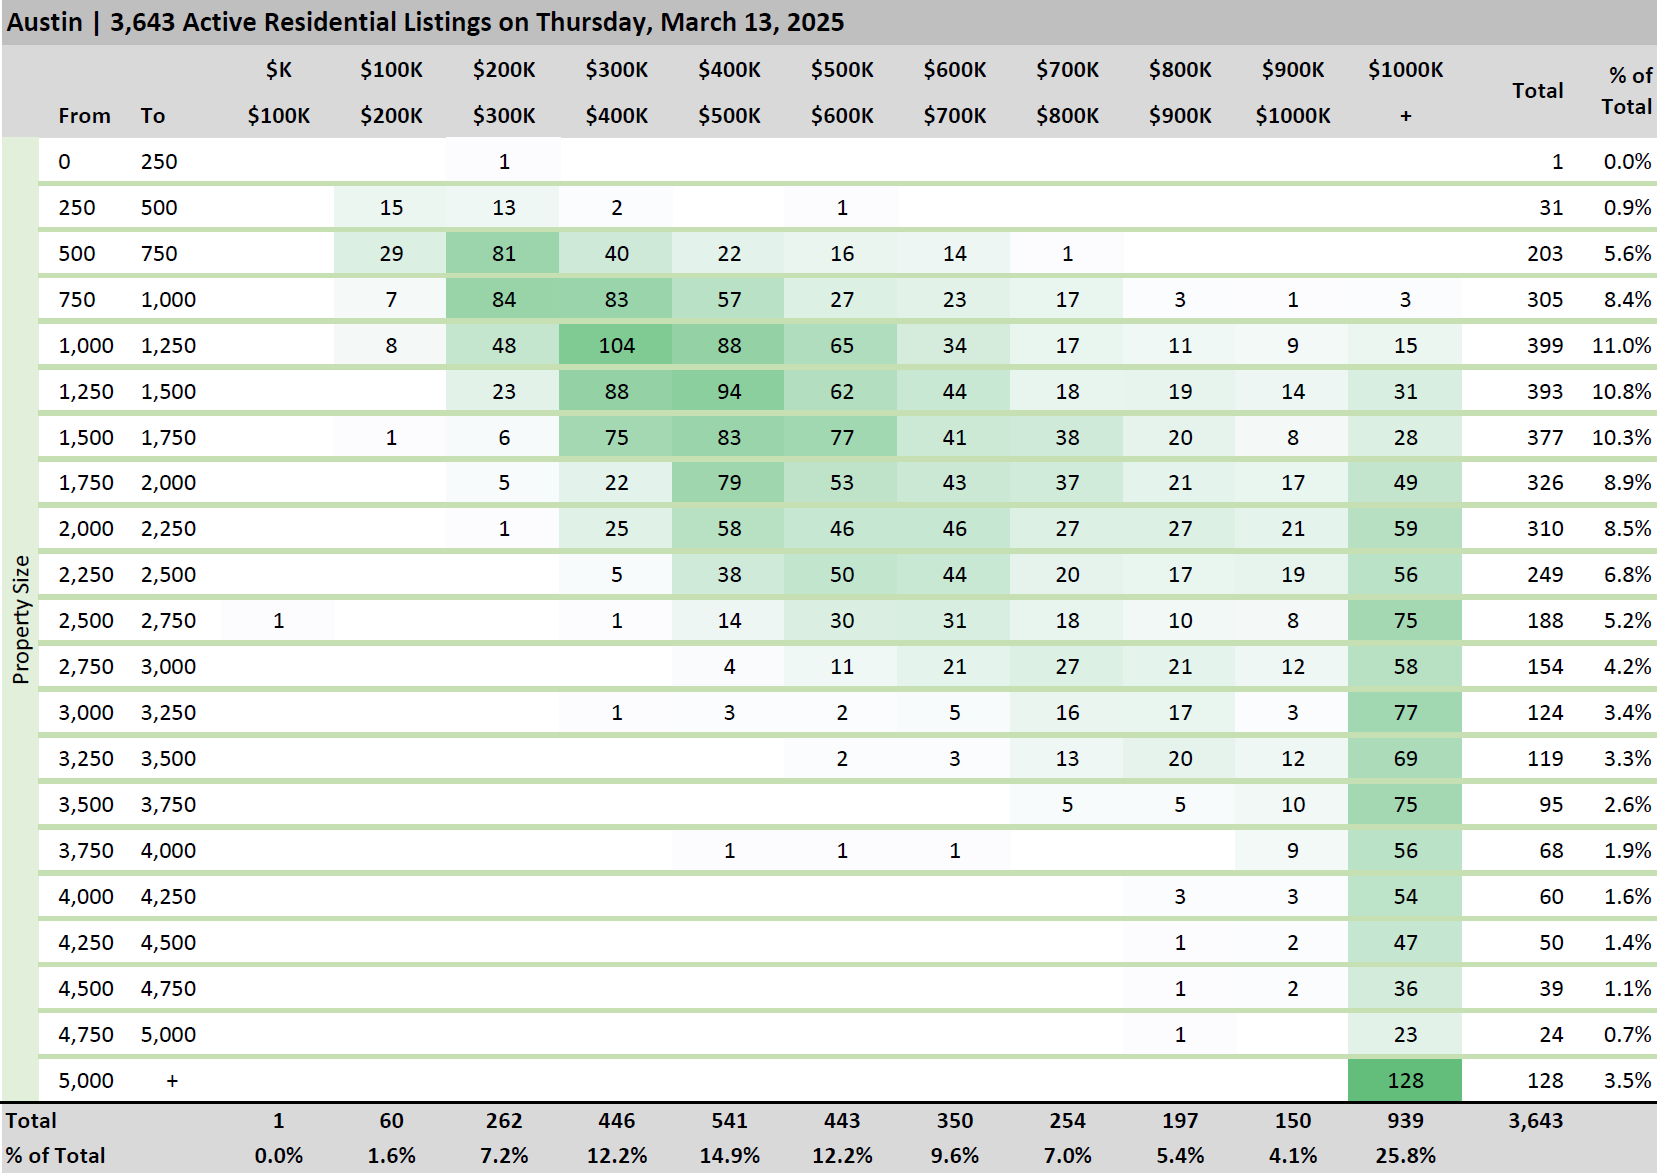
Austin’s residential real estate market on March 13, 2025, gives us a clear look at homes currently for sale, based on detailed data from Team Price Real Estate. With 3,643 active listings, we can explore how long these homes have been sitting on the market, how many are available in different price ranges and sizes, and how quickly they’re moving toward contracts. This analysis focuses on active listings only—those still waiting for buyers—offering a snapshot of inventory and demand in one of America’s hottest cities.
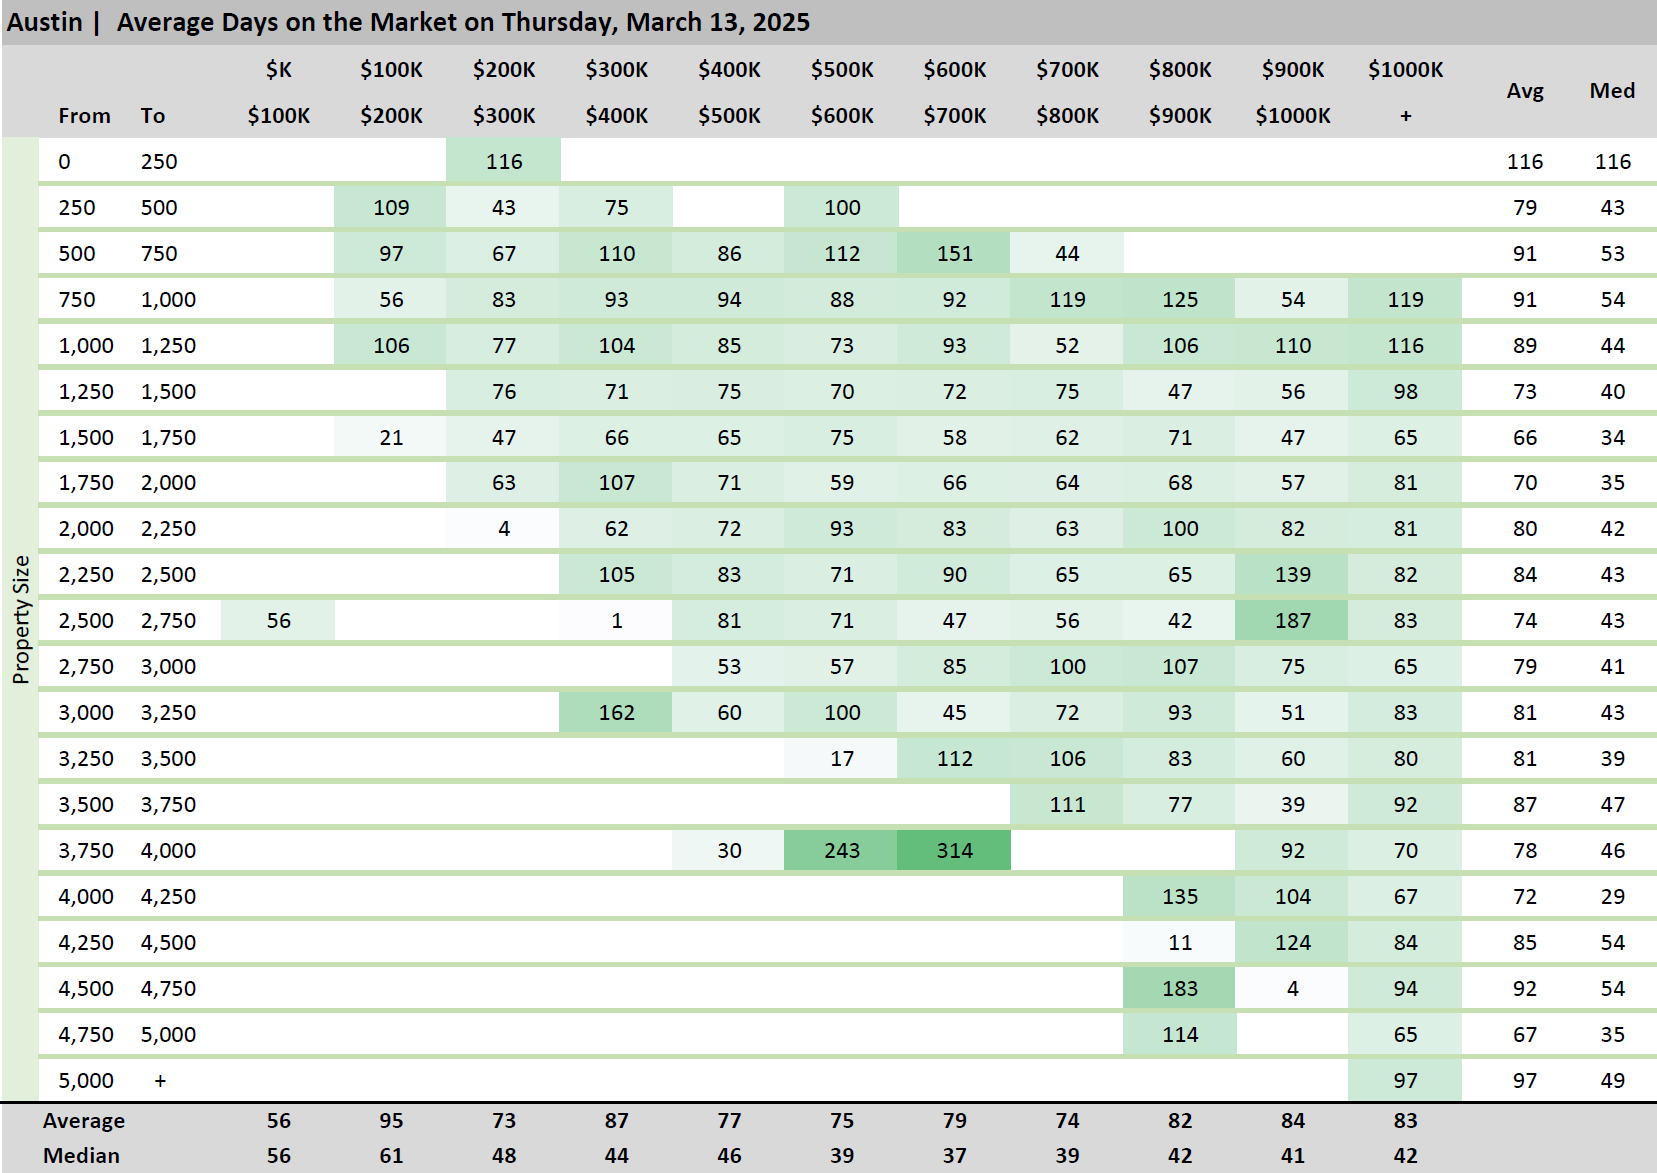
Let’s begin with the days on the market for these active homes. Across all 3,643 listings, the average time on the market is 83 days, while the median is 42 days. This means half of Austin’s active homes have been listed for 42 days or less, but some have lingered longer, pushing the average higher. For example, homes priced between $600,000 and $700,000 have been active for an average of 75 days and a median of 39 days, while those in the $200,000 to $300,000 range show an average of 95 days and a median of 61 days—the longest of any price group. By size, homes between 1,500 and 1,750 square feet have been on the market for an average of 66 days with a median of 34 days, the shortest median among size ranges. In contrast, tiny homes under 250 square feet average 116 days, indicating they’ve been sitting unsold for nearly four months.
Next, let’s examine the number of active listings available on March 13, 2025. Out of the 3,643 total, the largest share—939 homes, or 25.8%—is priced at $1 million or higher, highlighting a big pool of luxury properties still on the market. The $500,000 to $600,000 range has 541 listings, making up 14.9%, and $400,000 to $500,000 follows with 446 homes, or 12.2%. When it comes to size, homes between 1,000 and 1,250 square feet top the list with 399 listings, or 11%, while those from 1,250 to 1,500 square feet have 393 listings, or 10.8%. Smaller homes are less common, with just 31 listings between 250 and 500 square feet and only one under 250 square feet, showing how rare tiny properties are among active inventory.
How much buyer interest are these active homes seeing? The activity index, calculated as the percentage of pending homes out of the total active plus pending pool, sheds light on this. Across price ranges, the $500,000 to $600,000 segment leads with a 37% activity index, meaning 37% of homes in this range are under contract, even as 541 remain active. The $1 million-plus category is close behind at 37.5%, despite its 939 active listings. The $200,000 to $300,000 range, however, shows the lowest activity at 18.8%, with 60 homes still unsold. By size, homes between 2,000 and 2,250 square feet have a 28.5% activity index, while those from 1,250 to 1,500 square feet sit at 23.8%. Smaller homes between 250 and 500 square feet lag at 15.6%, suggesting less buyer movement in that segment.
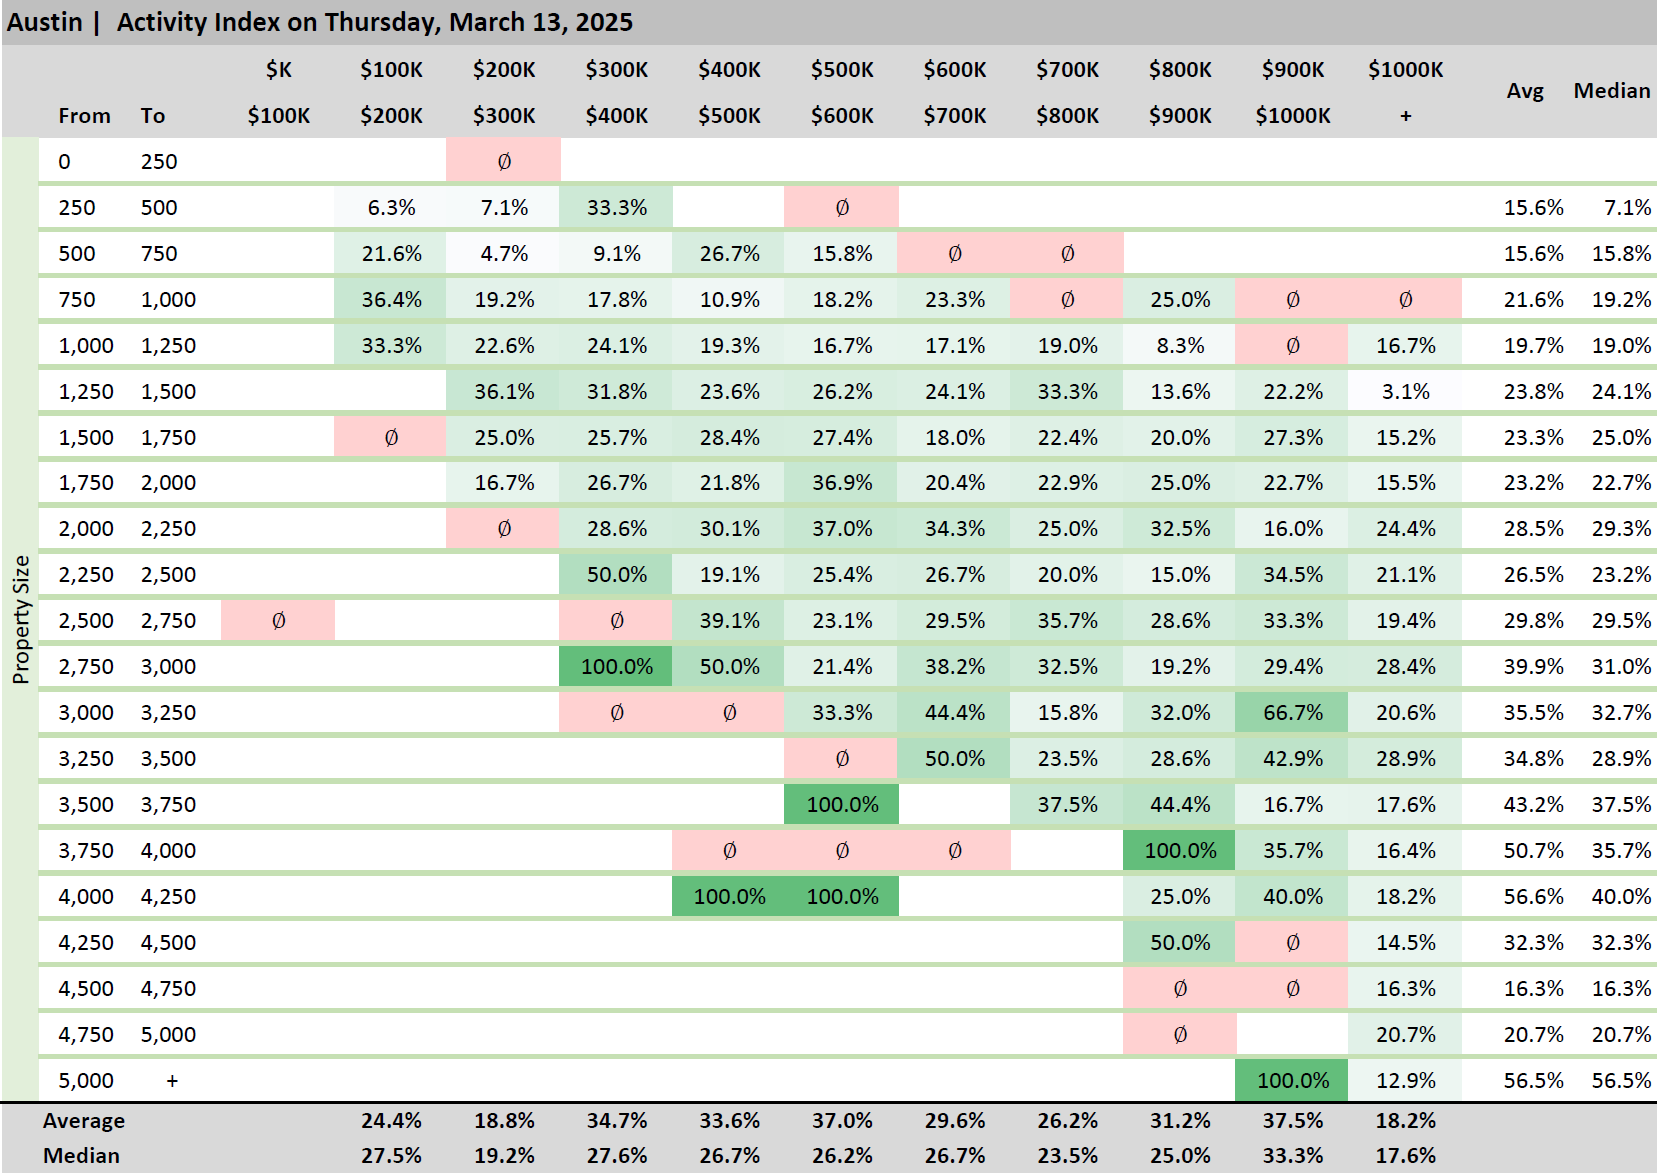
Digging deeper, certain price and size combinations reveal more about these active listings. For homes sized 2,000 to 2,250 square feet in the $500,000 to $600,000 range, there are 58 active listings with a 37% activity index, yet they’ve been on the market an average of 72 days. In the $200,000 to $300,000 range, homes between 500 and 750 square feet have 81 active listings but a mere 4.7% activity index, with an average of 67 days on the market, showing slow interest. Luxury homes over $1 million sized 2,750 to 3,000 square feet have a 39.9% activity index, but with sparse active listings, they’re part of the broader $1 million-plus group averaging 84 days on the market.
The interplay of price and size among active listings tells a bigger story. The mid-range, from $400,000 to $700,000, accounts for 39.3% of inventory with 1,430 active homes, including 541 at $500,000 to $600,000 and 443 at $600,000 to $700,000. These homes show activity indexes from 29.6% to 37% and have been active for medians of 39 to 46 days. Homes sized 1,250 to 2,000 square feet, with 1,096 active listings, make up 30% of the total and have median days on the market from 34 to 40 days, paired with activity indexes of 23.2% to 28.5%. At the high end, the 939 active listings over $1 million have a 37.5% activity index but an average of 84 days, suggesting many luxury homes remain unsold longer. The low end, with 60 active homes between $200,000 and $300,000, faces an 18.8% activity index and a 95-day average, indicating these scarce listings aren’t drawing much attention.
What does this mean for Austin’s active housing market? The data shows a market where mid-range homes between $400,000 and $700,000 dominate inventory with 1,430 listings and see strong buyer interest, with activity indexes above 29% and medians under 46 days. The luxury segment, with 25.8% of active listings at $1 million or more, maintains a 37.5% activity index, but its 84-day average points to a slower pace for these 939 homes. Smaller, cheaper homes under $300,000, just 1.6% of the total with 60 listings, have been active the longest at 95 days on average and show the weakest activity at 18.8%. Size-wise, the 1,000 to 2,000 square foot range, with 41% of active listings, balances solid activity with shorter median days on the market.
Based on Team Price Real Estate’s data from March 13, 2025, Austin’s active residential market reflects a diverse landscape. With 3,643 homes currently listed, an overall average of 83 days on the market, and activity indexes peaking at 37% in key price ranges, the market leans toward strength in its mid and upper tiers. Whether it’s a 1,500-square-foot home active for a median of 34 days or a $1 million-plus property with high buyer interest, Austin’s active listings show a city with plenty of homes still waiting for the right buyer as of mid-March 2025.
FAQ
How long have homes been on the market in Austin in 2025?
As of Marc 13, 2025, active homes in Austin have an average of 83 days on the market and a median of 42 days. Homes sized 1,500 to 1,750 square feet have the shortest median at 34 days, while those under 250 square feet average 116 days.
How many active homes are for sale in Austin right now?
On March 13, 2025, there are 3,643 active residential listings in Austin. The most are over $1 million (939 homes), followed by $500,000 to $600,000 with 541 listings.
What’s the most common price range for active homes in Austin?
Among active listings on March 13, 2025, the $500,000 to $600,000 range has 541 homes (14.9% of the total), the largest below $1 million. It also has a 37% activity index, showing buyer interest despite 541 still being unsold.
Are luxury homes sitting unsold in Austin in 2025?
Luxury homes over $1 million make up 939 active listings (25.8%) as of March 13, 2025, with an average of 84 days on the market. Their 37.5% activity index suggests many are moving toward contracts, but plenty remain available.
What size homes are most available in Austin’s active market?
On March 13, 2025, active homes between 1,000 and 1,250 square feet lead with 399 listings (11%), followed by 1,250 to 1,500 square feet with 393 (10.8%). These sizes also have median days on market of 34 to 44 days.
Related Articles
Keep reading other bits of knowledge from our team.
Request Info
Have a question about this article or want to learn more?
