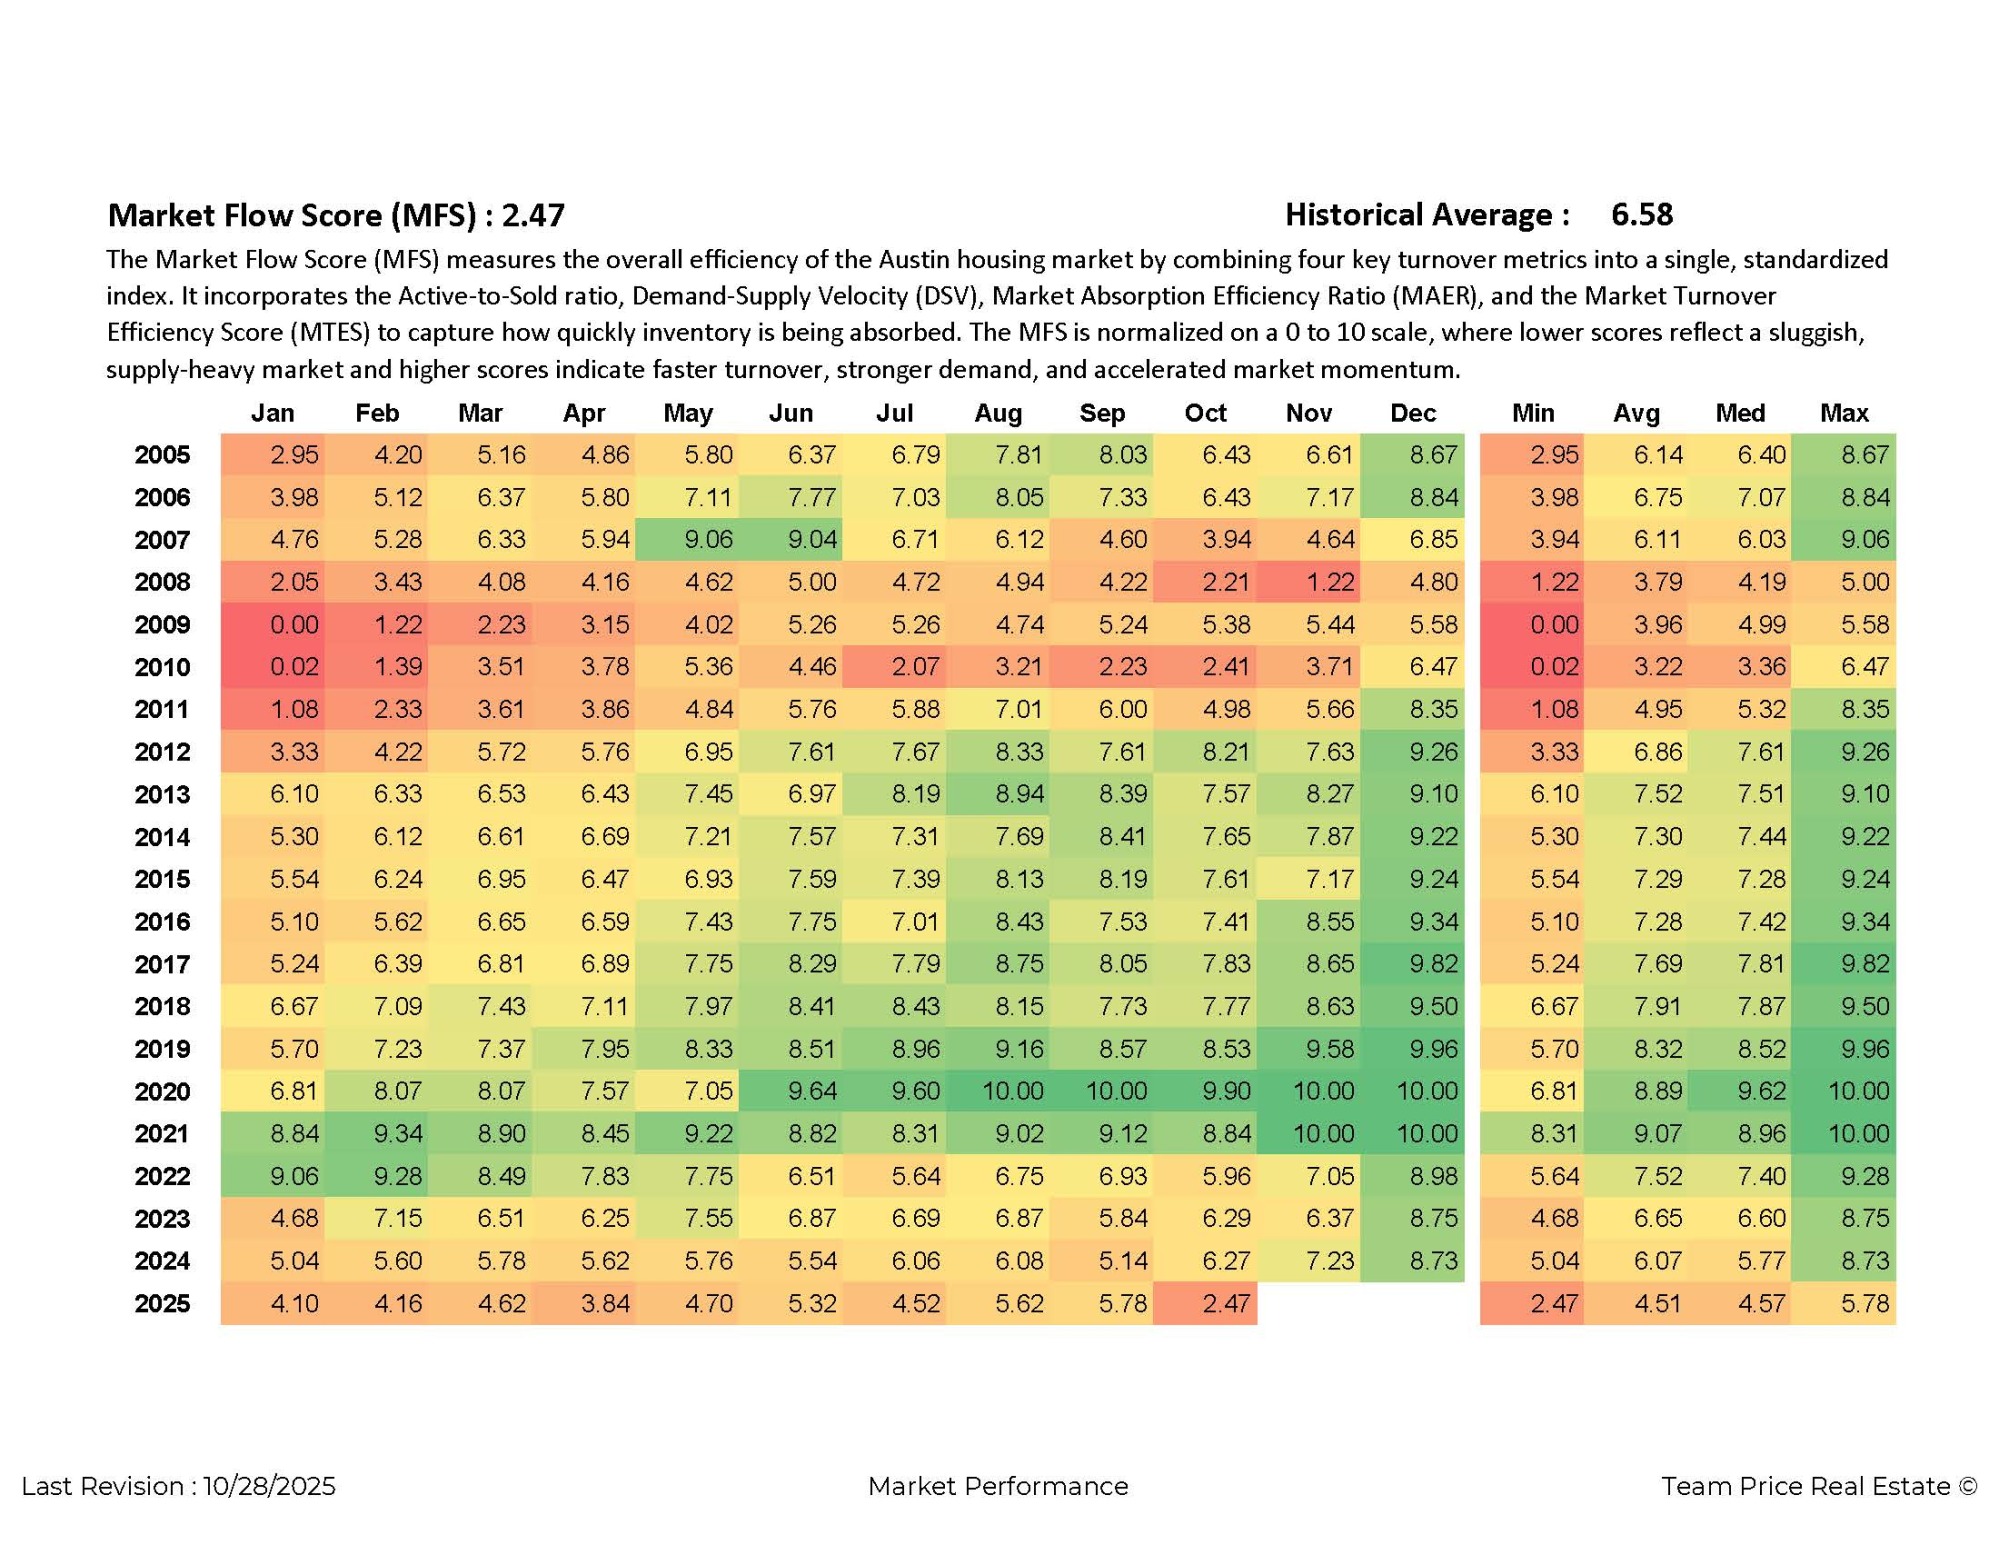
October 28,2025: In the Austin-area housing market, the recently defined Market Flow Score (MFS) is offering a clearer read on how swiftly homes are moving from listing to sale, and what that means for buyers and sellers. The MFS is a monthly index scaled from 0 to 10 that captures inventory absorption efficiency—how quickly active listings convert to pending or sold. A higher score signals strong buyer demand and fast turnover, while a lower score indicates slower activity, possible oversupply, or hesitant buyers. The formula behind the MFS blends metrics such as the Active-to-Sold ratio, Demand-Supply Velocity, Market Absorption Efficiency Ratio, and Market Turnover Efficiency Score, and then rescales these elements relative to historical minimum and maximum bounds to create a standardized index. A reading between 0.0 and 1.0 denotes a “Frozen Market,” 1.1-2.5 a “Slow Market,” 2.6-4.0 a “Frictional Market,” 4.1-5.5 a “Balanced Flow,” 5.6-7.5 an “Active Market,” and 7.6-10.0 an “Accelerated Market.”
Turning to the data for the Austin-Round Rock-San Marcos metro area, the August 2025 MFS registered at 5.04, up from 4.46 in July. This marked the strongest monthly improvement so far in 2025 and pushed the index into the “Balanced Flow” range. Historically however, this score remains well below the levels seen during boom years: in August 2022 the MFS measured 6.75, August 2023 came in at 6.87, and during the height of the pandemic, the score often exceeded 9.0. Thus, while the uptick to 5.04 signals that absorption efficiency is improving, it remains far below the “Active” or “Accelerated” zones that would reflect a hot seller’s market.
Other housing market data paint a consistent picture of moderation. In June 2025, median home prices in the region stood at about $449,900, essentially flat compared with June 2024, while active listings rose significantly and months-of-inventory (MOI) reached about 5.5. In the city of Austin alone in June the median was roughly $587,000, with 5.7 months of inventory. More recent details for October 2025 report 16,237 active residential properties, 3,973 pending, an Activity Index of 19.66 percent, an MOI of 5.6, a median sold price of $435,000 and an average sold price of $591,655 — the average down roughly 20.9 percent from the May 2022 peak.
What all of this means through the lens of the MFS is that the Austin housing market is now moving more like a “Balanced Flow” market rather than an overheated seller’s market. Buyer engagement is present, inventory is being absorbed more steadily, but sellers are unlikely to see the rapid multiple-offer turnaround typical of the previous era. The MFS’s context as a leading indicator is also relevant: historically when the MFS climbs into the upper 7s or higher and remains elevated, home-price growth often resumes within four to eight months. Thus, tracking future monthly changes in the MFS will provide important signals about whether the market is turning back toward “Active” or “Accelerated” conditions.
In sum, the MFS sharpens understanding of the Austin housing market by focusing on turnover and absorption rather than just listing counts or average prices. The current reading of 5.04 signals a transition from slower conditions toward healthier flow, but it falls short of the elevated levels that would indicate a full seller’s-market resurgence. Stakeholders in the Austin area should monitor this score alongside inventory levels, days on market and price movements to assess upcoming shifts in market balance.
Frequently Asked Questions:
1. What is the Market Flow Score (MFS) and how is it used in the Austin-area housing market?
The Market Flow Score (MFS) is a monthly index scaled from 0.0 to 10.0 that measures how efficiently the Austin-area housing market is absorbing inventory — that is, how fast listings convert to pending or sold. It goes beyond raw counts of listings or average prices by combining multiple turnover metrics (such as the Active-to-Sold ratio, Demand-Supply Velocity, Market Absorption Efficiency Ratio, and Market Turnover Efficiency Score) and rescaling them using historical minimum and maximum values to provide a consistent monthly gauge of market flow. A high MFS indicates strong buyer engagement and fast-moving inventory; a low MFS signals sluggish turnover, buyer hesitation or oversupply. In the Austin-area, for example, when the MFS was above 7.6, the market was in the “Accelerated Market” zone — homes were selling quickly and sellers held leverage. In 2025 the reading of 5.04 places the market back in “Balanced Flow,” showing that turnover is improving but is still below the historically strong “Active” zone (5.6-7.5) or higher.By using the MFS, market participants (buyers, sellers, agents) gain a clearer metric of market pace and absorption beyond price trends alone.
2. What does an MFS of 5.04 mean for buyers and sellers in the Austin real-estate market?
An MFS reading of 5.04 in the Austin-area (August 2025) signals that the market is in the “Balanced Flow” range (4.1–5.5). This means supply and demand are more evenly matched than during either the overheated seller’s market or a slow buyer’s market. For buyers, a balanced flow means there is still measurable competition, but there is more time to shop and negotiate than in a rapid-turnover period. For sellers, it means you’re less likely to see the near-instant multiple-offer scenarios of the peak period, and pricing, presentation and marketing become more important to converting a listing efficiently. Compared with the long-run average MFS of 6.58 in the Austin region (which is firmly in the “Active Market” zone), a 5.04 shows the market has softened, though it is functioning reasonably well. In short, the MFS at 5.04 confirms that the market is healthy, but not frothy: it is not at peak seller-leverage, but not stalled either.
3. How does the MFS compare to other traditional housing-market indicators in Austin, such as inventory, days on market and median price?
Traditional indicators like median home price, active listing counts, months-of-inventory (MOI) and days on market (DOM) capture different slices of the market. The MFS complements these by focusing on turnover efficiency — how quickly homes are moving through the system. For example, in June 2025 the Austin region had a median sold price of about $449,900 and an MOI of 5.5, showing supply was moderate and prices stable. Yet the MFS reading of 5.04 spotlights that while listings are being absorbed, the pace is slower than during the high-velocity years when MFS consistently sat in the 6–9 range or higher. Thus MFS adds context: when median price is flat and inventory is rising, a falling MFS will flag that absorption is slowing — something traditional metrics might not highlight until later. Therefore, using MFS alongside inventory and pricing gives a fuller picture of market health.
4. What are the defined market-condition ranges for the MFS and what do they signify in Austin’s context?
The Market Flow Score (MFS) uses defined ranges to interpret market conditions: 0.0–1.0 is a “Frozen Market,” 1.1–2.5 a “Slow Market,” 2.6-4.0 a “Frictional Market,” 4.1-5.5 “Balanced Flow,” 5.6-7.5 an “Active Market,” and 7.6-10.0 an “Accelerated Market.” In the Austin region’s historical context, when the MFS was above 7.6, homes were often selling very quickly, buyer urgency was high, and sellers had strong leverage. With the current reading around 5.04, the market is in the “Balanced Flow” zone: not frozen, not hyper-heated. For Austin sellers this suggests realistic pricing and preparation matter; for buyers it offers more opportunity and less urgency than peak years. Should the MFS climb back into the 5.6-7.5 range (Active) it would indicate broader demand revival. If it dropped into the 2.6-4.0 “Frictional” area the market would tilt toward slower turnover and buyer leverage.
5. Why should market watchers in Austin track the MFS, and what could a change in the score signal?
Tracking the MFS gives a pre-emptive view into market momentum rather than waiting for lagging indicators (such as eventual price changes). In Austin’s case, when the MFS rose into the upper 7’s or higher historically, it often preceded renewed price growth and tighter inventory. Conversely, a drop into the 2’s or 3’s suggests longer days on market, weakening buyer demand and growing inventory. With the current MFS at 5.04, market watchers can interpret that the shift has moved toward more balance, but the market isn’t yet in a sustained seller-favorable cycle. If the MFS begins a consistent upward trajectory toward 6.0+ that may signal a shift toward an “Active” market and possible return of tighter conditions for buyers. On the flip side, a sustained decline toward 3.0 or below would suggest absorption is weakening and the market may tilt toward a buyer-advantaged phase. In sum, the MFS serves as a forward-looking gauge of market health in Austin rather than simply a retrospective measure.