Single-Family Home Permits in Central Texas: A 25-Year Look at Market Activity
May 6, 2025: Over the past 25 years, single-family home construction in Central Texas has experienced cycles of growth, slowdown, and recovery. Based on monthly permit data from 2000 to 2025, the number of building permits issued each year reflects the shifting dynamics of the local housing market.
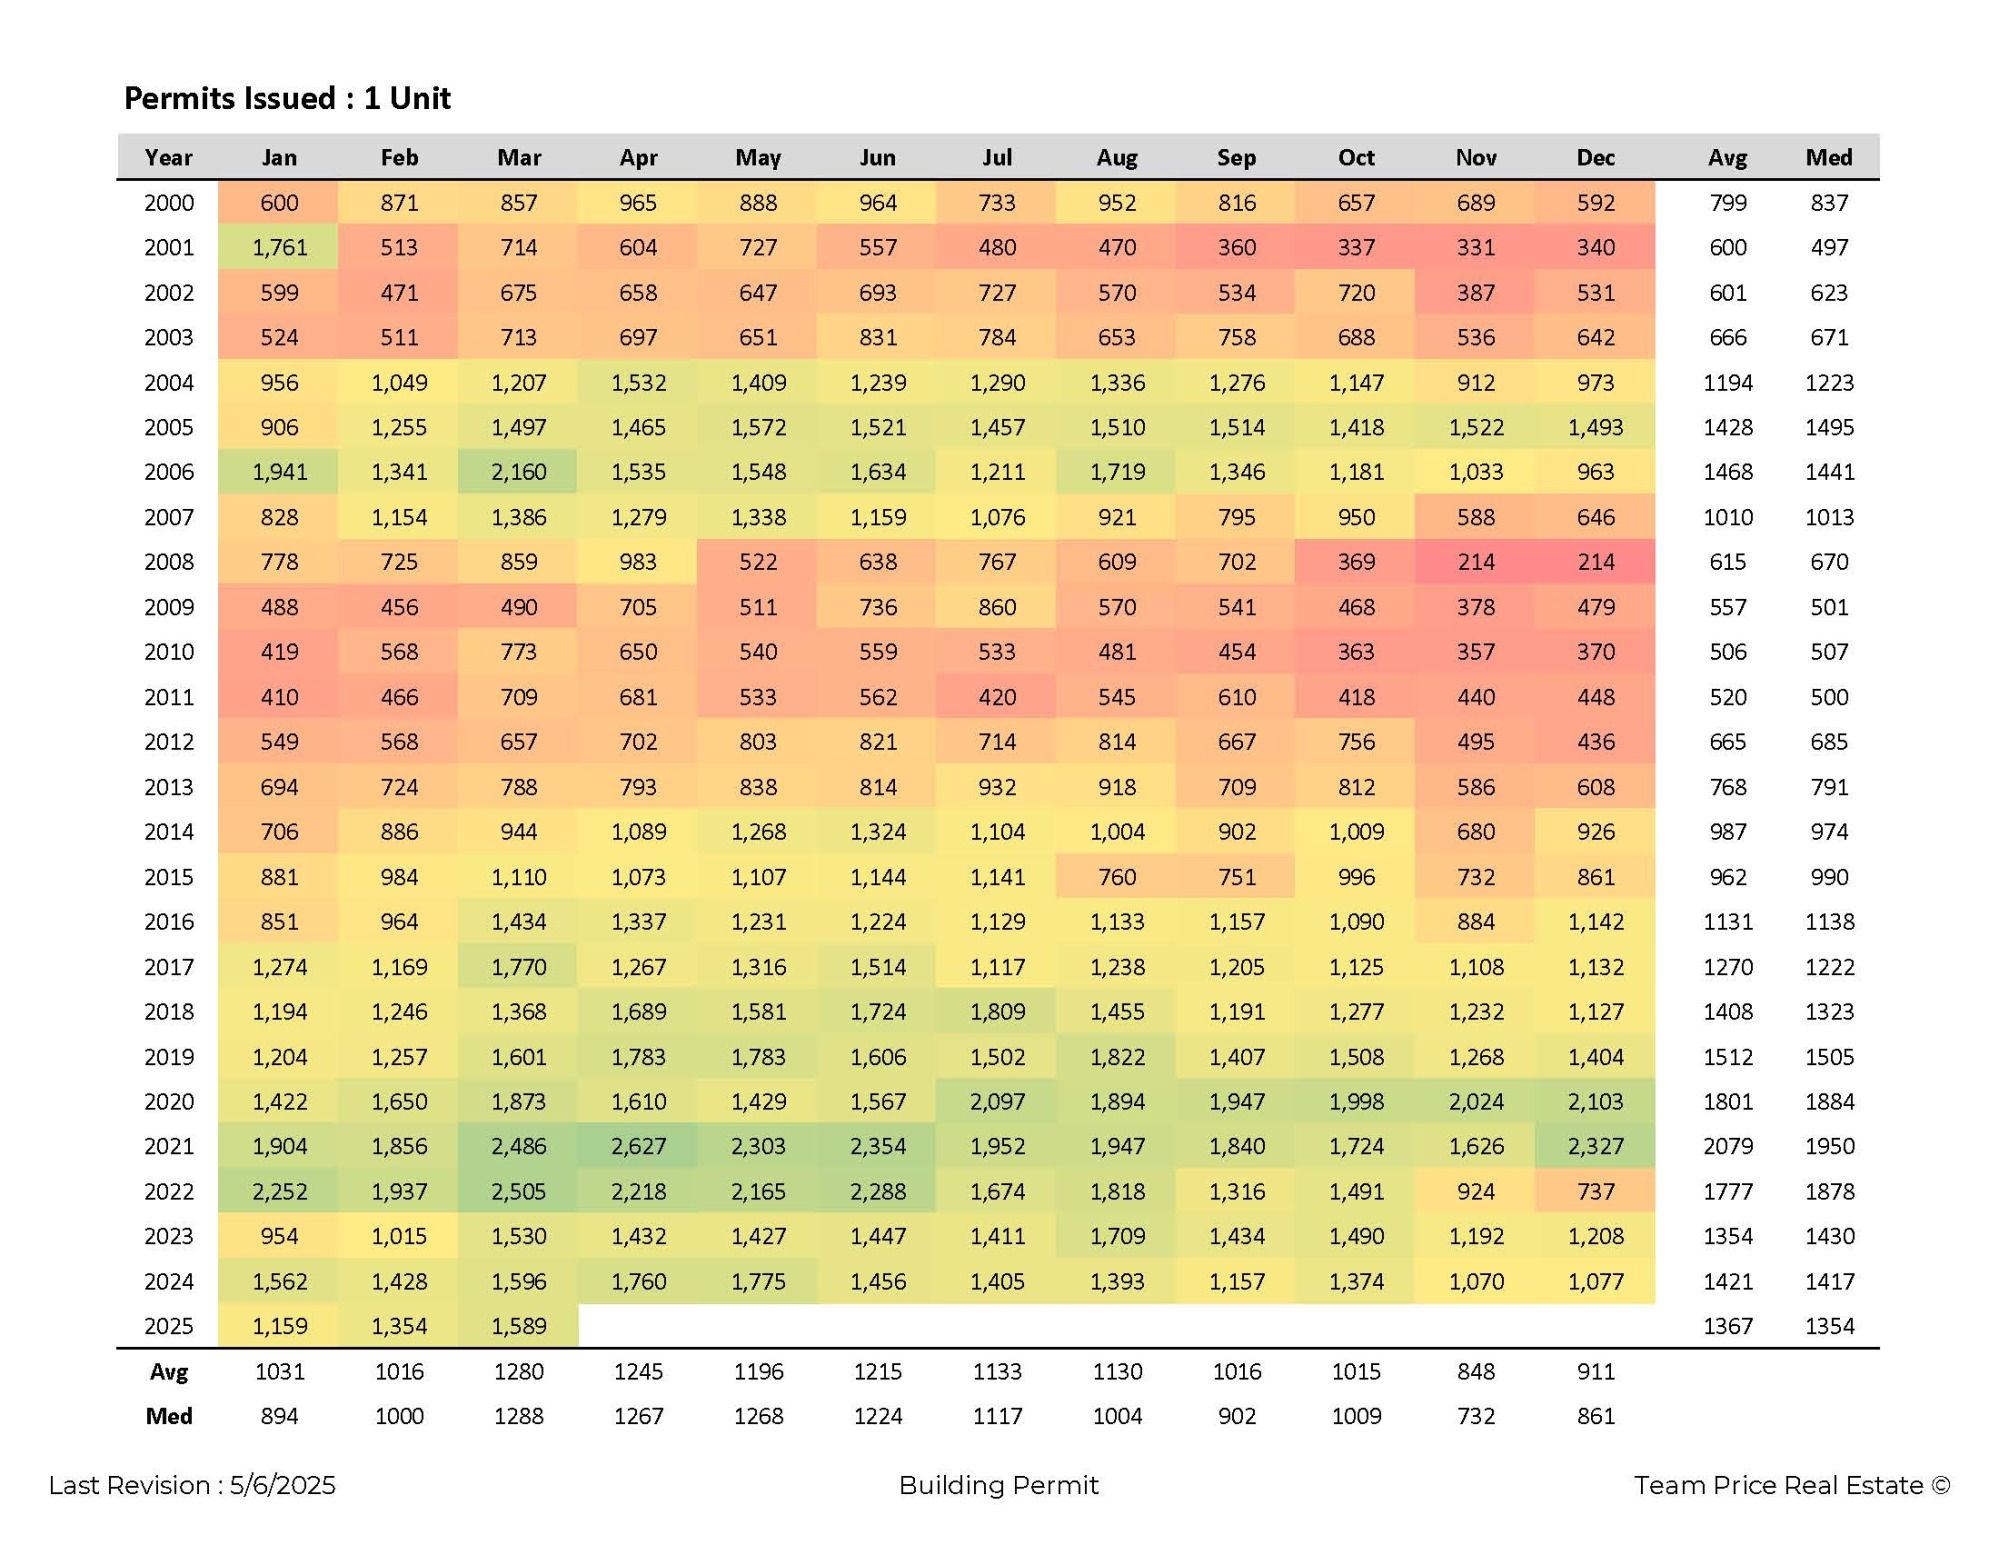
In 2000, the monthly average of single-family permits was 799, with a median of 837. The following years showed a decline, with 2001 averaging 600 permits per month. The early 2000s remained relatively stable until 2004, when a significant increase began. That year, monthly averages rose to 1,194, and by 2005 the market surged to an average of 1,428 permits per month. Some months in 2005 surpassed 1,500 permits, indicating strong demand and a growing economy.
The upward trend continued in 2006, reaching a peak in March with 2,160 permits issued—the highest single-month total in the dataset. The yearly average that year was 1,468. However, the housing crisis soon followed. By 2007, averages dropped to 1,010 per month, and in 2008 and 2009, the numbers declined further. In 2009, the average was just 557 permits monthly, with late 2008 seeing monthly totals as low as 214.
Recovery began slowly in the 2010s. By 2012, monthly averages climbed to 665, and in 2013 that number rose to 768. Growth continued through 2014 and 2015, with yearly averages reaching 987 and 962, respectively. The market remained strong in 2016 and 2017, with average monthly permits rising to 1,131 in 2016 and 1,270 in 2017.
From 2018 to 2019, the pace of construction remained high. In 2018, the average was 1,408 permits per month, and in 2019, it rose to 1,512. The pandemic period in 2020 and 2021 brought unprecedented growth in homebuilding. In 2020, the monthly average jumped to 1,801, and in 2021, it reached 2,079. April 2021 marked the highest month of that year with 2,627 permits.
In 2022, the market began to slow, with the yearly average falling to 1,777 permits per month. While the early months remained strong, permit numbers dropped in the second half of the year. In 2023, the average decreased further to 1,354 per month, with relatively even distribution throughout the year. By 2024, the average remained steady at 1,421 permits monthly, but lower than the peak years. So far in 2025, data through April shows monthly permits ranging from 1,159 in January to 1,589 in March, averaging about 1,367.
This 25-year trend of single-family permits shows how Central Texas has grown, adapted, and shifted through changing economic conditions. From housing booms in the early 2000s to the challenges of the recession, and the surge during the pandemic, permit activity provides a clear window into local real estate development patterns. The recent data points to a stable but cooling market, with permit activity remaining above historical lows but below the highs of 2020 and 2021.