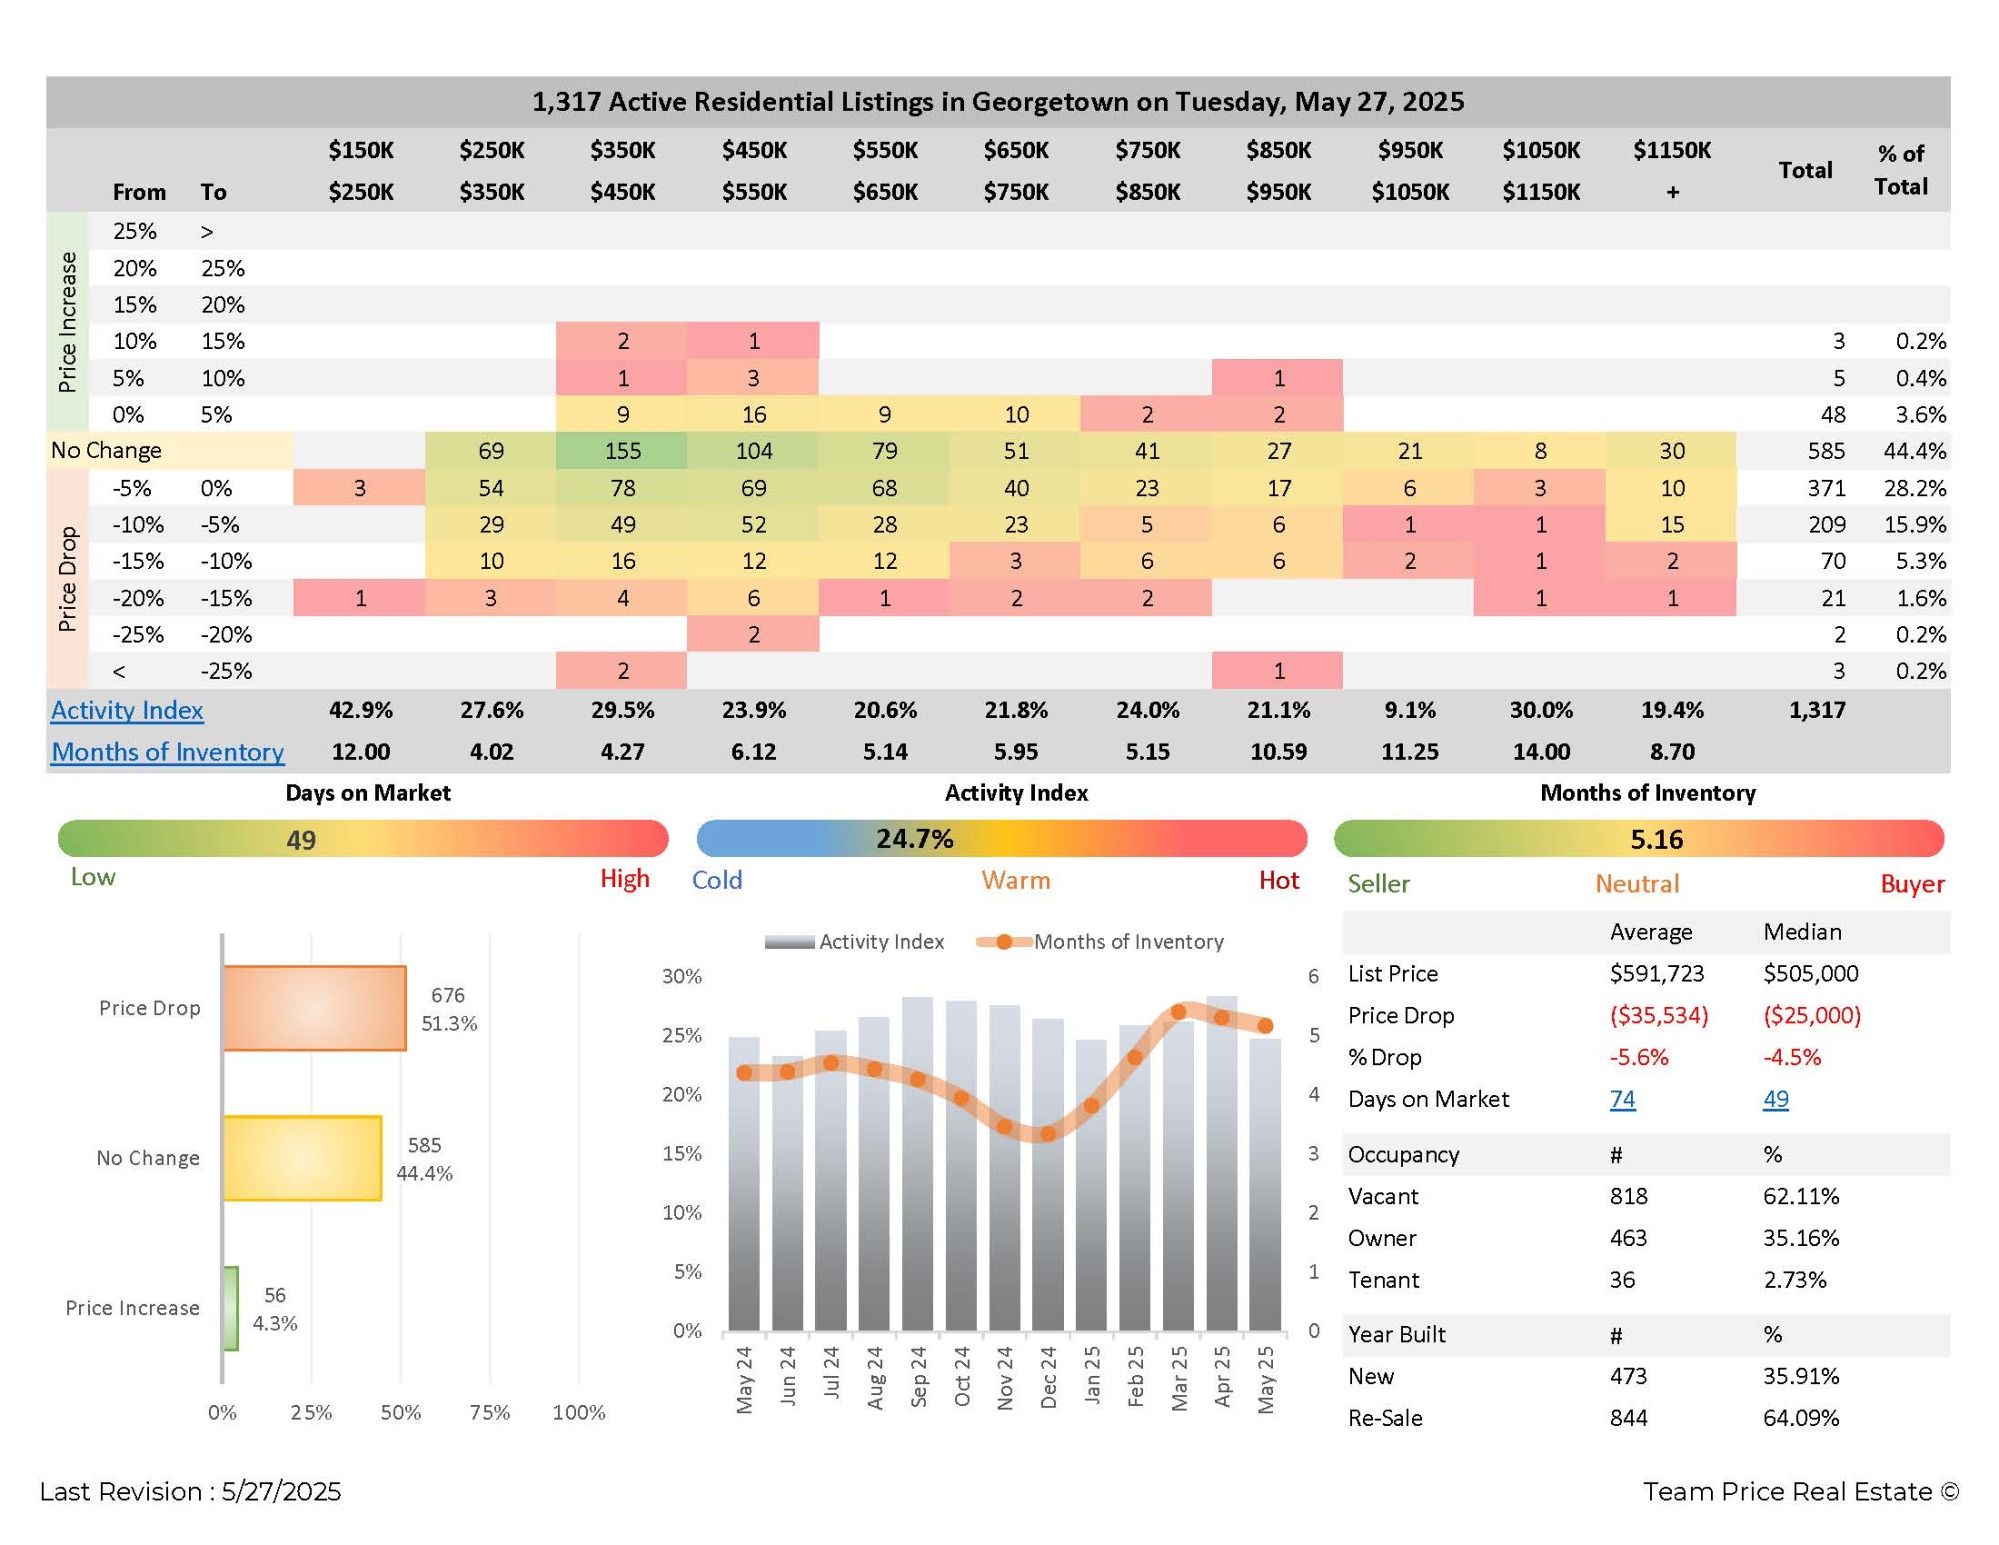
May 27,2025:The Georgetownresidential real estate market shows signs of price adjustments and varied buyer activity as of May 27, 2025. With 1,317 active listings recorded, the average list price in Georgetown reached $591,723, while the median list price came in at $505,000. The difference between the average and median price reflects the influence of higher-priced homes on the overall market numbers.
Price reductions were common during this period. A total of 676 listings, or 51.3% of the market, showed a price drop. The average price decrease was $35,534, which equals a 5.6% reduction from the original list price. The median price drop was $25,000, reflecting a 4.5% decrease. In contrast, 585 listings, or 44.4%, remained at their original asking price. Only 56 properties, or 4.3%, experienced price increases, indicating limited upward movement.
The Activity Index, which reflects buyer interest, was strongest in the $250,000 to $350,000 price range at 42.9%. This level of engagement dropped as prices increased, falling to 27.6% for homes priced between $350,000 and $450,000 and to just 9.1% for homes in the $1.05 million to $1.15 million range. This pattern suggests that lower- and mid-priced homes are seeing more demand, while higher-end properties are experiencing slower buyer activity.
Months of Inventory, which measures how long it would take to sell all current listings at the current sales pace, also varied by price. Homes priced from $250,000 to $350,000 had just over 4 months of inventory, pointing to stronger competition among buyers. However, properties in the $1.05 million to $1.15 million range had 14 months of inventory, indicating more supply than demand. The range from $550,000 to $650,000 had an inventory level of 5.14 months, while homes priced from $950,000 to $1.05 million had 11.25 months.
On average, homes stayed on the market for 74 days, with a median of 49 days. The length of time properties remain unsold shows that the market is not moving quickly, especially in higher price brackets. The majority of listings—62.11%—were vacant. Owner-occupied properties made up 35.16% of the market, and tenant-occupied homes accounted for 2.73%. Re-sale homes made up 64.09% of the inventory, while new construction accounted for 35.91%.
The distribution of price changes shows that most price drops were between 5% and 10%, affecting 28.2% of all listings. About 15.9% of listings dropped between 10% and 15%, while only a small portion saw more significant reductions. Most price changes clustered within a relatively moderate range, with deep discounts being rare.
In summary, the Georgetown housing market in May 2025 was more active in the mid-price range, with price reductions widespread and buyer interest concentrated below $550,000. Inventory levels in higher price points were elevated, which may result in longer market times and greater price flexibility from sellers.
Frequently Asked Questions – Georgetown TX Housing Market (May 2025)
1. What is the average and median list price for homes in Georgetown, TX as of May 2025?
As of May 27, 2025, the average list price for homes in Georgetown was $591,723, while the median list price was $505,000. The gap between these figures indicates a concentration of higher-priced properties that raise the average above the middle point of the market.
2. How many homes in Georgetown have had price reductions?
Out of 1,317 active residential listings, 676 homes—51.3% of the market—had price drops. The average price reduction was $35,534, or about 5.6%, and the median drop was $25,000, or approximately 4.5%. In contrast, only 4.3% of homes had price increases.
3. Which price range is seeing the most buyer activity in Georgetown?
The highest buyer activity was recorded in the $250,000 to $350,000 price range, with an Activity Index of 42.9%. As prices increase, buyer activity generally declines, dropping to 9.1% in the $1.05 million to $1.15 million range.
4. What are the current months of inventory in Georgetown, and what does it indicate
Months of Inventory (MOI) varies widely by price range. Homes priced between $250K and $350K had an MOI of 4.02, reflecting strong buyer interest. Meanwhile, homes priced between $1.05M and $1.15M had an MOI of 14.00, suggesting much slower movement and higher competition among sellers.
5. How long are homes staying on the market in Georgetown?
Homes in Georgetown averaged 74 days on the market, with a median of 49 days. These numbers suggest a slower-moving market, especially in higher price tiers, where elevated inventory and longer days on market are more common.