June 10,2025: The Fannie Mae Home Purchase Sentiment Index® (HPSI) is a widely watched monthly measure of how consumers feel about the housing market. This index tracks six key areas: home price expectations, mortgage rate expectations, job security, income outlook, and whether it’s a good time to buy or sell a home. The HPSI offers important insights into buyer and seller behavior, helping real estate professionals, economists, and policymakers understand market trends.
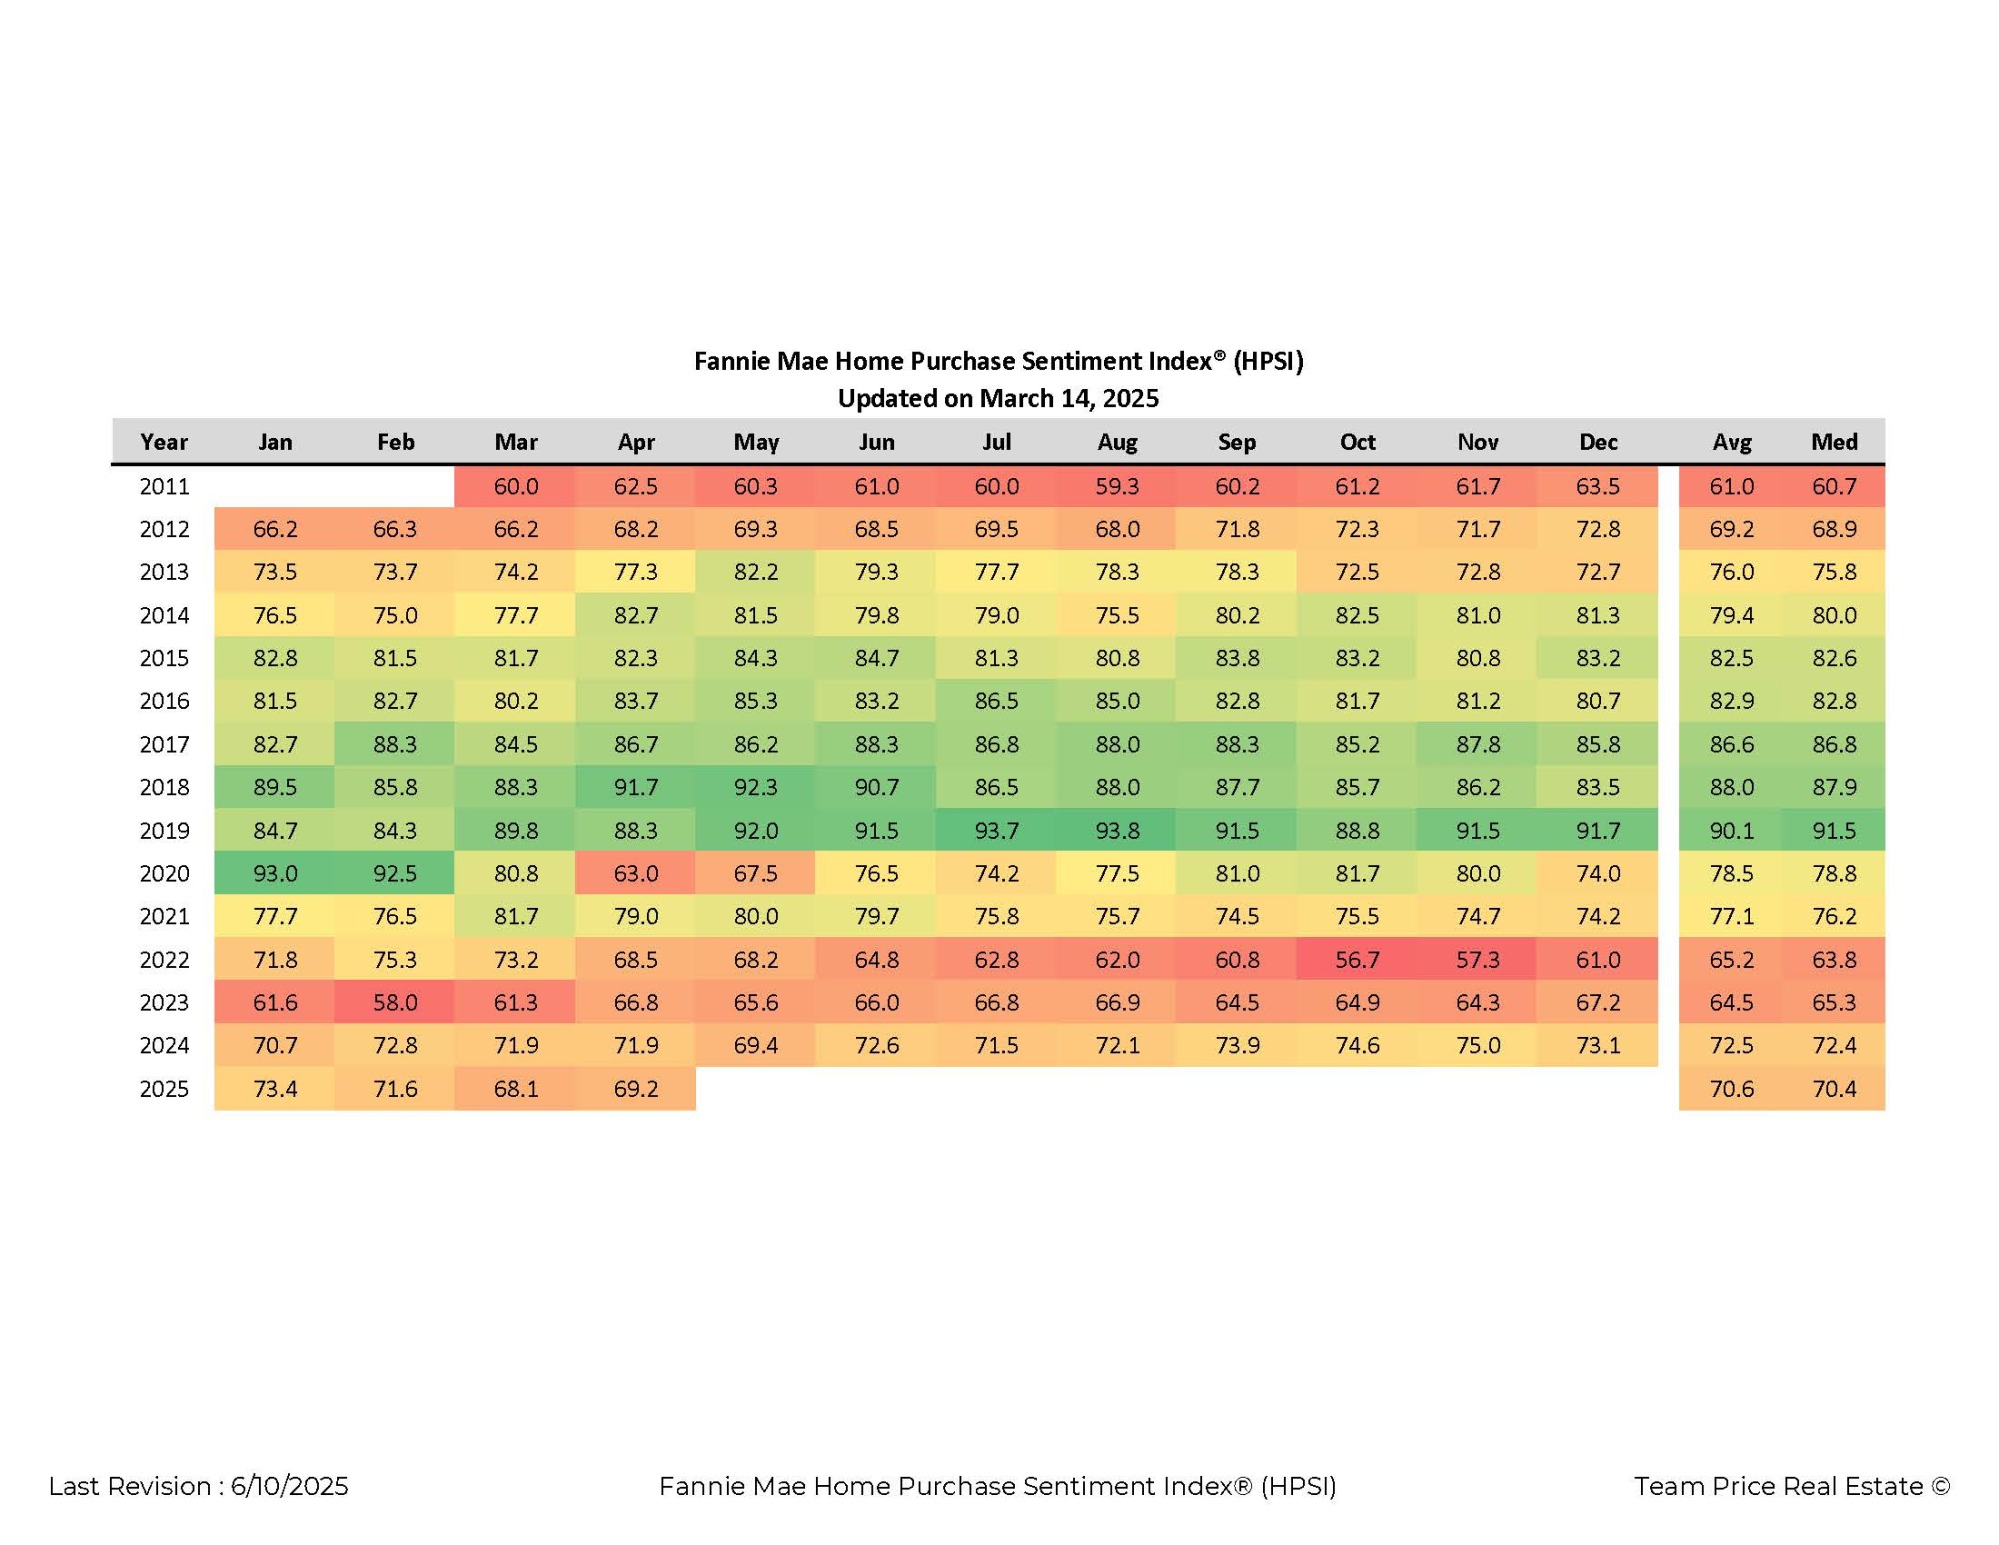
Since its tracking began in 2011, the HPSI has reflected both highs and lows in consumer sentiment. In 2011, the monthly index ranged between 59.3 and 63.5, with an annual average of 61.0. This period marked a time of cautious recovery from the housing crash, with consumers still uncertain about price trends and employment stability.
From 2012 through 2015, confidence grew steadily. The index averaged 69.2 in 2012 and climbed to 82.5 by 2015. In 2013, the index broke into the 70s, with the highest monthly score that year reaching 82.2 in May. In 2014 and 2015, most months stayed in the 80s, reflecting strong optimism and an improving job market.
The HPSI reached new heights in the years that followed. In 2016, the average rose to 82.9. By 2017 and 2018, monthly readings often exceeded 85, with a peak of 92.3 in May 2018. The upward trend continued into 2019, which recorded the highest annual average of 90.1. August and September 2019 both saw readings above 93, marking the most confident period in the index’s history.
The COVID-19 pandemic in 2020 brought a sudden shift. The index started strong at 93.0 in January, but it dropped sharply to 63.0 in April as lockdowns and uncertainty set in. Although it partially recovered by the end of the year, the annual average for 2020 fell to 78.5. This decline marked a major shift in how consumers felt about buying or selling a home.
In 2021, the index stabilized but did not return to pre-pandemic highs. The average for that year was 77.1. Consumer concerns about rising home prices and limited inventory began to weigh on sentiment. The following year, 2022, showed a clear downward trend. Starting at 71.8 in January, the index dropped to a low of 56.7 in October. The yearly average fell to 65.2, the lowest since 2011.
In 2023, the index hovered between the upper 50s and upper 60s, with an average of 64.5. Monthly figures showed slight improvement throughout the year, ending with a December reading of 67.2. By 2024, sentiment was back on the rise. Each month posted scores in the low to mid-70s, with a peak of 75.0 in November and an annual average of 72.5.
As of June 2025, the HPSI continues to reflect moderate consumer optimism. January through June has shown readings ranging from 68.1 to 73.4, with June at 70.4. While not at the highs of 2019, the sentiment is much stronger than during the uncertainty of 2020 and 2022. The current data suggests that buyers and sellers are adjusting to the new housing market environment, where interest rates, inflation, and price expectations continue to shape decision-making.
Tracking the HPSI over time helps explain shifts in the housing market and provides useful context for anyone looking to understand where buyer and seller confidence stands today.
1. What is the Fannie Mae Home Purchase Sentiment Index (HPSI)?
The HPSI is a monthly index derived from six key questions in Fannie Mae’s National Housing Survey, tracking consumer confidence in the housing market. It reflects opinions on whether it’s a good time to buy or sell, expectations for home prices and mortgage rates, job security concerns, and household income changes. The index quantifies sentiment into a single score, offering insight into future housing market dynamics.
2. How is the HPSI calculated?
Each month, the HPSI averages the net positive responses from the six survey questions, then adds a constant (63.5) so that the starting value in March 2011 equals 60. Net response means the percentage of positive minus negative answers. This method produces a reliable, standardized sentiment metric that aligns with broader consumer sentiment measures.
3. What does the current HPSI value indicate?
As of June 2025, the HPSI ranges between 68.1 and 73.5 (January–May), with June at 70.4, indicating moderate optimism compared to past lows in 2022 (56.7 average). This suggests consumers are cautiously confident, balancing concerns about affordability and rising rates with stabilizing income and employment expectations.
4. Why did the HPSI drop during the COVID-19 pandemic?
In April 2020, the index plunged to 63.0 from January’s 93.0 due to pandemic-induced uncertainty—including market shutdowns, employment fears, and fluctuating mortgage rates. Though sentiment rebounded later in the year, the 2020 average fell to 78.5—well below the pre-pandemic 2019 high of 90.1.
5. Why is the HPSI important for housing market analysis?
The HPSI forecasts housing outcomes by reflecting consumer intentions. Increases in the index since 2011 have reliably led to stronger housing activity—such as price growth, sales volume, and mortgage origination. Unlike general consumer sentiment indexes, the HPSI specifically captures housing-related attitudes, making it uniquely valuable for real estate professionals and policymakers.