When Will the Housing Market Reach a Buyer’s Market? A Data-Driven Forecast for 2026–2027
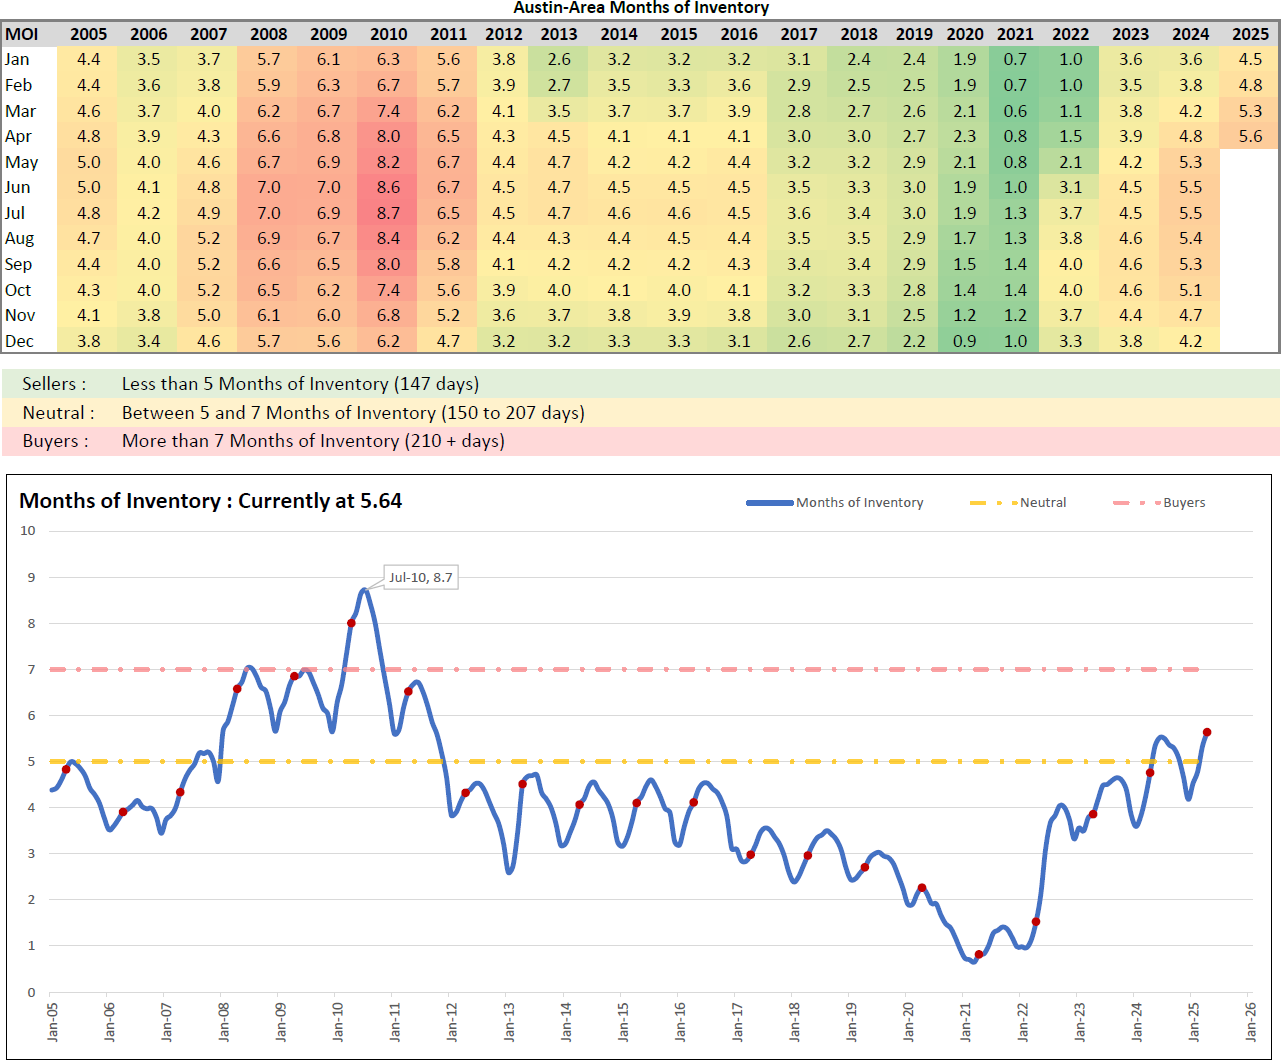
In April 2025, the residential housing market stands at a pivotal moment, with months of inventory (MOI) reaching 5.6 months, the highest level since October 2011, when it was also 5.6 months. This figure, drawn from a comprehensive dataset spanning 2005 to April 2025, signals a neutral market, where the balance between buyers and sellers is shifting. With 15,484 active residential listings, the market is cooling from the intense seller’s market of 2020–2021, when MOI dropped to a low of 0.6 months in March 2021. A key question for homebuyers and sellers alike is: when will the market tip into a buyer’s market, defined as an MOI exceeding 7 months? By analyzing historical trends and recent increases in inventory, this article forecasts when this shift might occur, providing a clear, data-driven perspective.
The dataset reveals distinct market phases from 2005 to 2025. Between 2005 and 2007, MOI ranged from 3.4 to 5.2 months, indicating a seller’s market where homes sold quickly. The financial crisis of 2008–2010 pushed MOI to a peak of 8.7 months in July 2010, creating a strong buyer’s market with ample inventory. For example, April 2010 saw an MOI of 8.0 months, reflecting sluggish demand. By 2011, the market began recovering, with April 2011 at 6.5 months and October 2011 at 5.6 months. From 2012 to 2019, MOI stabilized between 2.2 and 4.7 months, favoring sellers or maintaining neutrality. The pandemic years of 2020–2021 marked an extreme seller’s market, with April 2020 at 2.3 months and April 2021 at just 0.8 months, as demand surged and inventory plummeted.
Since 2022, the market has steadily cooled, with MOI climbing each year. In April 2022, MOI was 1.5 months, but by April 2023, it rose to 3.9 months, followed by 4.8 months in April 2024, and now 5.6 months in April 2025. This upward trend reflects increasing inventory or declining demand, possibly influenced by higher interest rates or economic uncertainty. To forecast when MOI will cross the 7-month threshold for a buyer’s market, the rate of increase in April MOI from 2022 to 2025 provides critical insight. From April 2022 to April 2023, MOI increased by 2.4 months, from April 2023 to April 2024 by 0.9 months, and from April 2024 to April 2025 by 0.8 months. The average year-over-year increase over these three years is 1.37 months, suggesting a rapid shift toward a buyer-friendly market.
However, the rate of increase has slowed in recent years, offering a more nuanced forecast. Taking the average increase from 2023 to 2025 (0.9 and 0.8 months), the rate drops to 0.85 months per year. Examining monthly data from 2024 to 2025, the year-over-year increases for January (0.9 months), February (1.0 months), March (1.1 months), and April (0.8 months) yield an average of 0.95 months per year. These figures allow for multiple forecasting scenarios. Using the broader 2022–2025 average of 1.37 months per year, starting from 5.6 months in April 2025, MOI would reach 7 months in approximately 1.02 years, or around May 2026. With the more recent 0.85-month-per-year rate, it would take 1.65 years, pointing to November 2026. The 0.95-month-per-year rate, balancing recent trends, suggests 1.47 years, or September 2026.
Seasonal patterns in the data add another layer to the forecast. MOI often peaks in mid-year months like May through August and dips toward year-end. In 2024, MOI peaked at 5.5 months in June and July before falling to 4.2 months in December. Similarly, in 2010, MOI hit 8.7 months in July but dropped to 6.2 months by December. If this pattern holds, MOI may cross 7 months during a mid-year peak. Using the 0.95-month-per-year rate, by June 2026 (1.17 years from April 2025), MOI would reach approximately 6.71 months, still in the neutral zone. By June 2027 (2.17 years), it would climb to 7.66 months, firmly in buyer’s market territory. This suggests a mid-2027 buyer’s market is likely if seasonal trends persist.
An alternative approach uses a monthly linear regression from January 2022, when MOI was 1.0 month, to April 2025, when it reached 5.6 months. Over these 39 months, MOI increased by 4.6 months, or about 0.118 months per month. Starting from 5.6 months in April 2025, it would take approximately 11.86 months, or until April 2026, to reach 7 months. This monthly model aligns closely with the optimistic May 2026 forecast but assumes a steady increase without seasonal fluctuations. Combining these projections, the most likely window for reaching a buyer’s market is mid-2026 to mid-2027, with June 2026 as a balanced estimate, considering recent rates and seasonal peaks.
The dataset, last revised on April 17, 2025, underscores a market in transition. The 15,484 active listings in April 2025 reflect a growing supply, which could accelerate the shift to a buyer’s market if demand remains soft. Historical highs, like the 8.7 months in July 2010 or 8.0 months in April 2010, show that buyer’s markets have occurred during economic downturns, while the low of 0.6 months in March 2021 highlights the volatility of recent years. The steady rise from 1.5 months in April 2022 to 5.6 months in April 2025 indicates a clear trajectory, but external factors like interest rates or economic conditions could alter the pace.
In summary, the housing market is poised for a potential shift to a buyer’s market between mid-2026 and mid-2027, with June 2026 as a plausible target based on a 0.95-month-per-year increase and seasonal trends. Whether using the broader 1.37-month-per-year rate pointing to May 2026, the conservative 0.85-month-per-year rate indicating November 2026, or the monthly regression suggesting April 2026, the data consistently points to a buyer-friendly market within the next one to two years. As inventory continues to grow, homebuyers may soon find more options and negotiating power, while sellers may face longer selling times, marking a significant change from the seller-driven market of recent years.
FAQ Section
What is a buyer’s market in real estate?
A buyer’s market occurs when the months of inventory (MOI) exceeds 7 months, meaning it would take more than 210 days to sell all active listings at the current sales pace. In the provided data, April 2025 has an MOI of 5.6 months, indicating a neutral market, but historical peaks like 8.7 months in July 2010 show what a buyer’s market looks like, with more homes available and greater negotiating power for buyers.
How is months of inventory calculated?
Months of inventory is calculated by dividing the number of active listings by the average monthly sales rate. For example, in April 2025, with 15,484 active listings and an MOI of 5.6 months, it would take 5.6 months to sell all listings if no new homes were added. The data shows MOI fluctuating from 0.6 months in March 2021 to 8.7 months in July 2010, reflecting changes in supply and demand.
When was the last buyer’s market according to the data?
The last buyer’s market, with an MOI above 7 months, occurred in 2010. The data shows peaks of 8.0 months in April 2010, 8.6 months in June 2010, and 8.7 months in July 2010. Since then, MOI has generally stayed below 7 months, with April 2025 at 5.6 months being the highest since October 2011’s 5.6 months.