Kristin Stevens
    Kristin Stevens
    (512) 699-4216kristin@teamprice.com
      • Search
      • Market Report
      • Areas
        • Hutto
        • Fort Hood
        • Buda
        • Bastrop
        • Barton Hills
        • Round Rock
        • Cedar Park
        • Austin
        • Westlake Hills
        • Tarrytown
        • Crestview
        • Downtown Austin
      • Properties
        • Search Properties
        • Featured Properties
      • Insight
      • Market Update
      • Articles
      • News
      • About
        • Meet Kristin Stevens
        • About Team Price
        • Testimonials
      • Contact
      • Kristin Stevens(512) 699-4216
        kristin@teamprice.com
        Copy Email
      • Team Price Real Estate
        7320 N Mo-Pac
        Austin, TX 78731
        (512) 213-0213
        dan@teamprice.com

      Search

      • Search Properties
      • By City
      • By Subdivision
      • By Zip

      Explore

      • Featured Properties
      • Areas
      • Property Search

      Company

      • Guarantee
      • Work with Us
      • Interview Questions
      • Join Our Team

      Resources

      • Insight and Statistics
      • Tenant Pre-Screening
      • Real Estate Forms
      • Real Estate Glossary

      About

      • Home
      • About
      • Agents
      • Testimonials
      • Contact Us
      Kristin Stevens - Footer Logo
      • Texas Real Estate Commission Information About Brokerage Services
      • Texas Real Estate Commission Consumer Protection Notice
      • Privacy
      • Terms
      • DMCA
      • Accessibility
      • Fair Housing
      © 2025 Team Price Real Estate. All rights reserved.
      Website built by CloseHack.
      Central Texas Multiple Listing Service

      Central Texas MLS | Four Rivers Association of REALTORS® All information deemed reliable but not guaranteed. All properties are subject to prior sale, change or withdrawal. Neither listing broker(s) or information provider(s) shall be responsible for any typographical errors, misinformation, misprints and shall be held totally harmless. Listing(s) information is provided for consumer's personal, non-commercial use and may not be used for any purpose other than to identify prospective properties consumers may be interested in purchasing. The data relating to real estate for sale on this website comes in part from the Internet Data Exchange program of the Multiple Listing Service. Real estate listings held by brokerage firms other than Kristin Stevens may be marked with the Internet Data Exchange logo and detailed information about those properties will include the name of the listing broker(s) when required by the MLS. Copyright ©2022 All rights reserved.

      Austin Board of Realtors

      The information being provided is for consumers' personal, non-commercial use and may not be used for any purpose other than to identify prospective properties consumers may be interested in purchasing. Based on information from the Austin Board of REALTORS®. Neither the Board nor ACTRIS guarantees or is in any way responsible for its accuracy. All data is provided "AS IS" and with all faults. Data maintained by the Board or ACTRIS may not reflect all real estate activity in the market.

      • MLSGrid IDX Data Notice
      • DMCA Notice
      New Construction Real Estate: Where Prices Are Dropping and Rising

      New Construction Housing Market: Active Residential Listings and Pricing Trends

      Published 02/24/2025 | Posted by Kristin Stevens

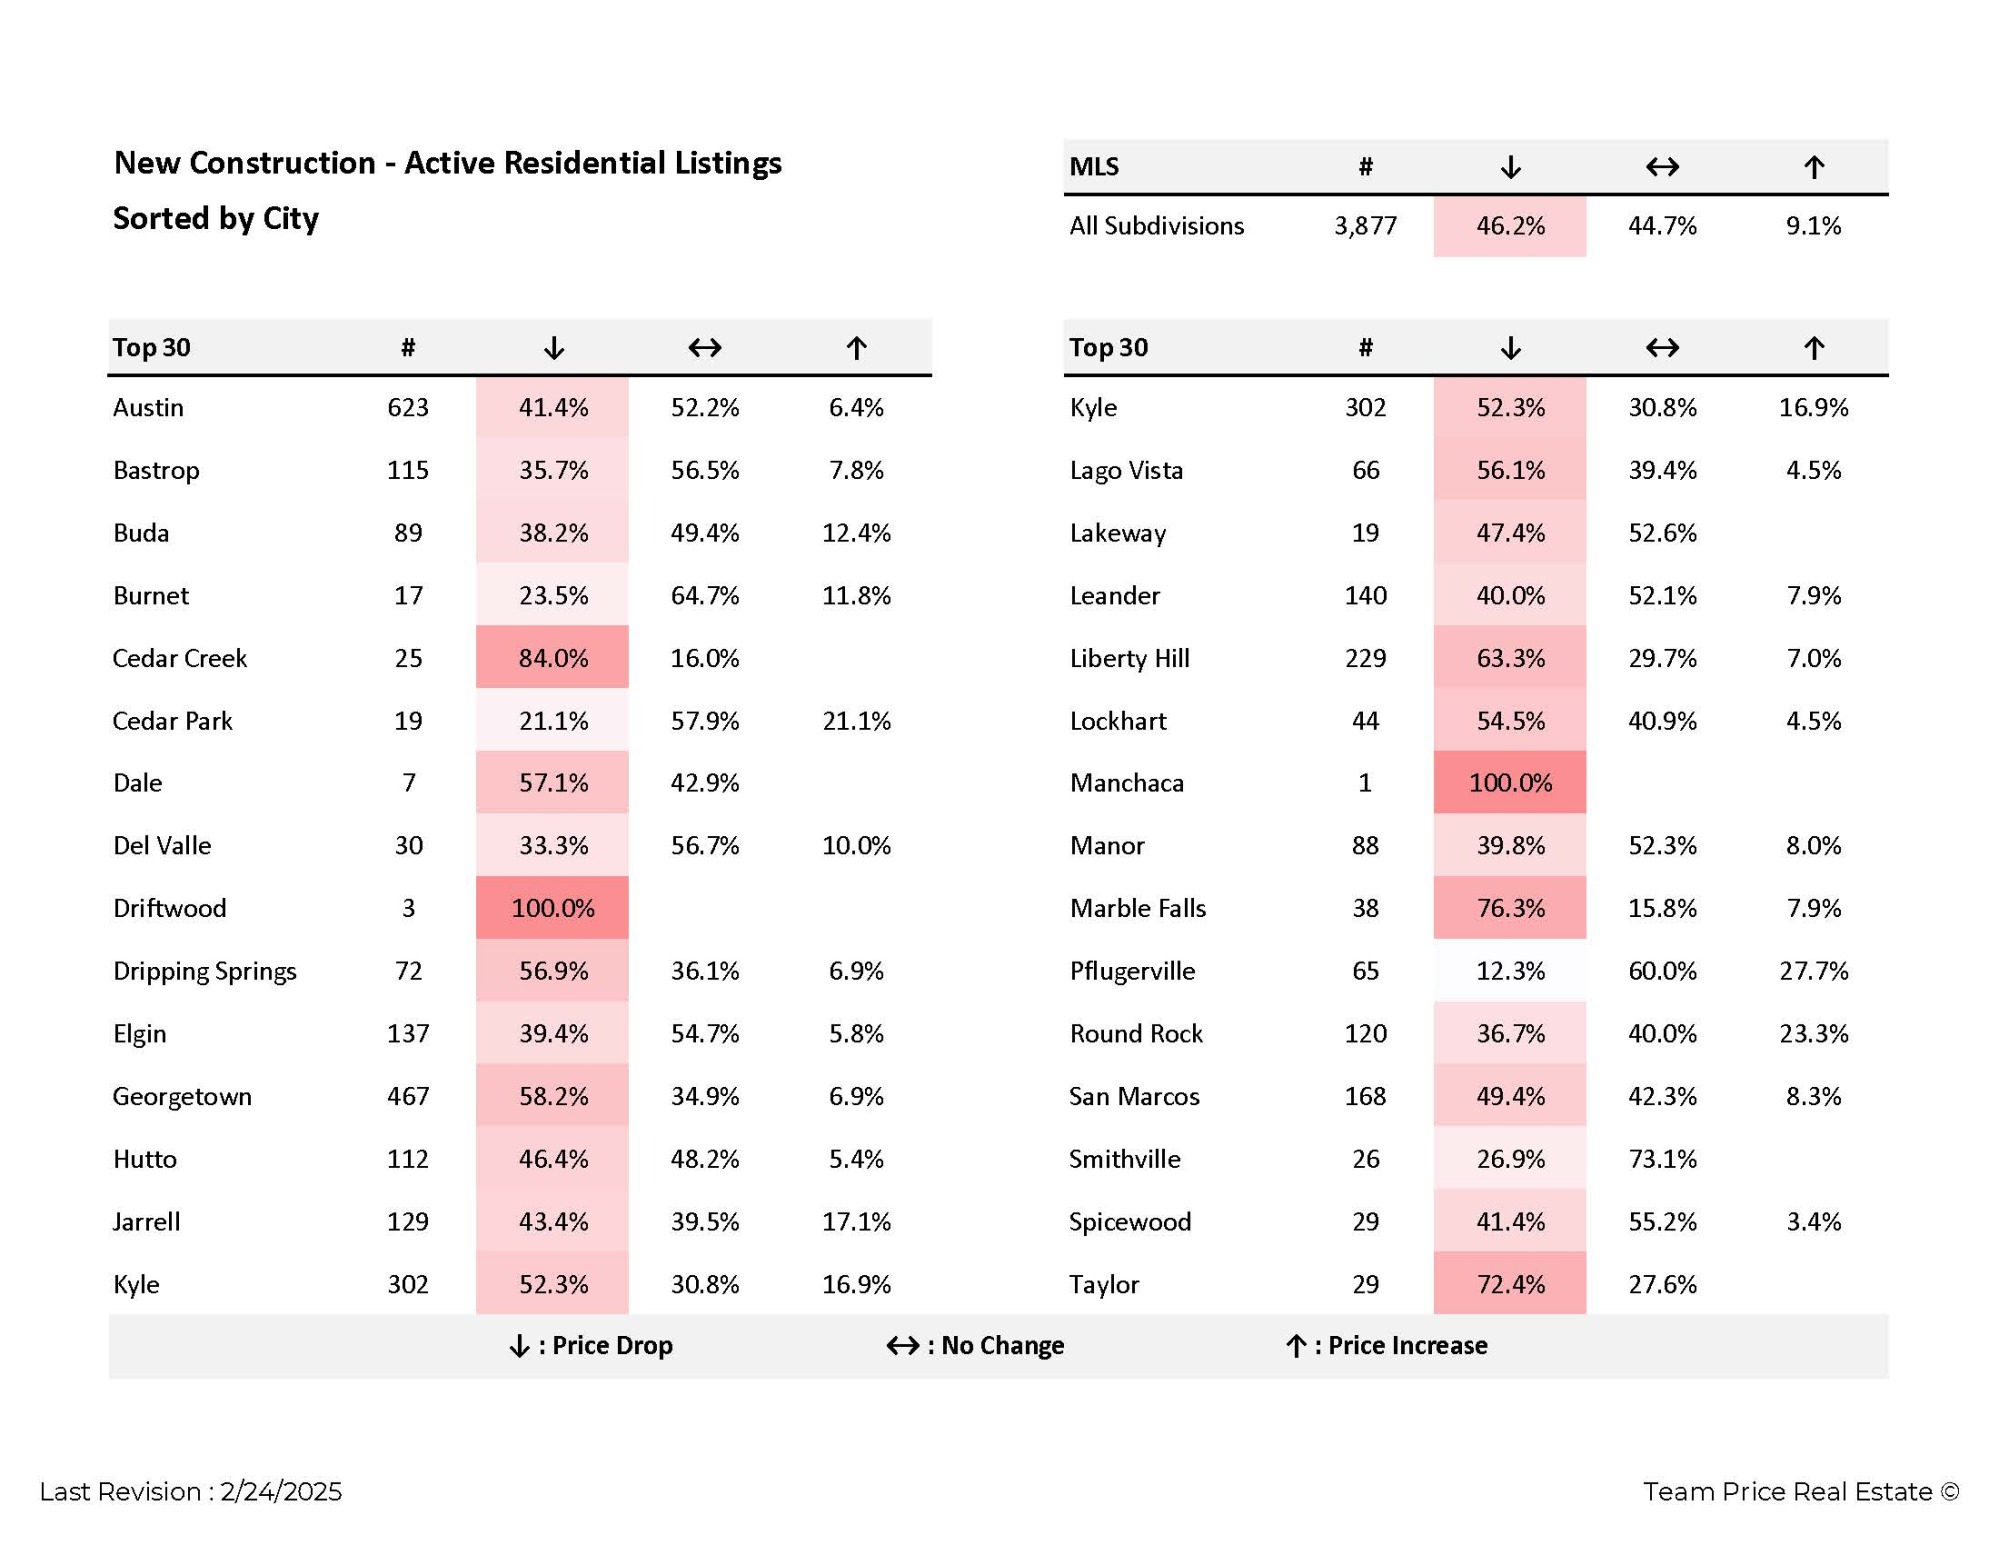
      February 24,2025: The real estate market is constantly evolving, and tracking new construction listings provides valuable insight into current pricing trends, buyer demand, and market shifts. With 3,877 active new construction listings, the latest data offers a comprehensive look at pricing fluctuations across multiple cities, helping homebuyers and investors make informed decisions.


      One of the key takeaways from this data is the distribution of price changes in various cities. In Austin, there are 623 active new construction listings, making it one of the most active markets. Of these, 41.4% have seen price reductions, indicating possible adjustments due to market conditions. Meanwhile, 52.2% of listings have remained unchanged, and 6.4% have increased in price, signaling a segment of properties gaining value despite broader trends.


      Another market showing significant activity is Georgetown, which has 467 active listings. More than half (58.2%) have experienced price drops, while 34.9% of listings have remained steady. Only 6.9% have seen price increases, suggesting that sellers in this area are responding to market pressures with competitive pricing strategies.


      In Kyle, which has 302 active listings, pricing trends show a mix of adjustments. 52.3% of homes have undergone price reductions, while 30.8% have held their original listing price. Notably, 16.9% of listings have increased in price, which is one of the highest percentages in the report. This suggests that while many sellers are lowering prices, certain properties are gaining value, possibly due to high demand in specific neighborhoods.


      Other cities reflect similar trends. Liberty Hill, with 229 active listings, has seen 63.3% of homes drop in price, while 29.7% remain unchanged. Meanwhile, 7.0% of homes have increased in price, showing a moderate level of price stability. Jarrell, another market with 129 active listings, follows a comparable pattern, with 43.4% of homes seeing price reductions and 17.1% increasing in value.


      Some cities have experienced even higher rates of price drops. Cedar Creek, for example, has 84.0% of its listings marked with price reductions, indicating potential oversupply or shifting buyer demand. In contrast, Driftwood and Manchaca stand out with 100% of their active listings maintaining their original prices, showcasing a rare instance of complete price stability.


      A closer look at Pflugerville reveals an interesting trend. Among its 65 active listings, 12.3% have seen price drops, but 60.0% remain unchanged. More notably, 27.7% of listings have increased in price, marking the highest percentage of price hikes among the top 30 cities. This could be an indicator of strong demand in the area, with certain properties appreciating in value despite broader market trends.


      For those monitoring pricing volatility, Round Rock is another area to watch. Out of 120 active listings, 36.7% have dropped in price, 40.0% remain steady, and 23.3% have seen price increases. The high percentage of price hikes suggests that certain pockets within the city are experiencing rising demand, leading to competitive pricing dynamics.


      Several smaller markets, such as Smithville (26 listings) and Taylor (29 listings), show high stability, with 73.1% and 72.4% of listings, respectively, holding steady at their original prices. This stability suggests less market fluctuation and possibly consistent buyer interest without drastic shifts in pricing strategies.


      Overall, the data highlights a mix of price drops, stability, and increases across different cities, showcasing the dynamic nature of the new construction market. Buyers looking for opportunities may find competitive pricing in areas with high price reductions, while investors should keep an eye on cities where prices are rising, signaling potential growth and demand.


      • New Construction Homes
      • real estate market trends
      • home prices 2025
      • housing market data
      • Price Reductions
      • active home listings
      • homebuyers market
      • real estate trends
      • Austin housing market
      • Georgetown home prices
      • Kyle new homes
      • Pflugerville real estate
      • price increases
      • housing supply and demand
      • new home construction

      Related Articles

      Keep reading other bits of knowledge from our team.

        Request Info

        Have a question about this article or want to learn more?