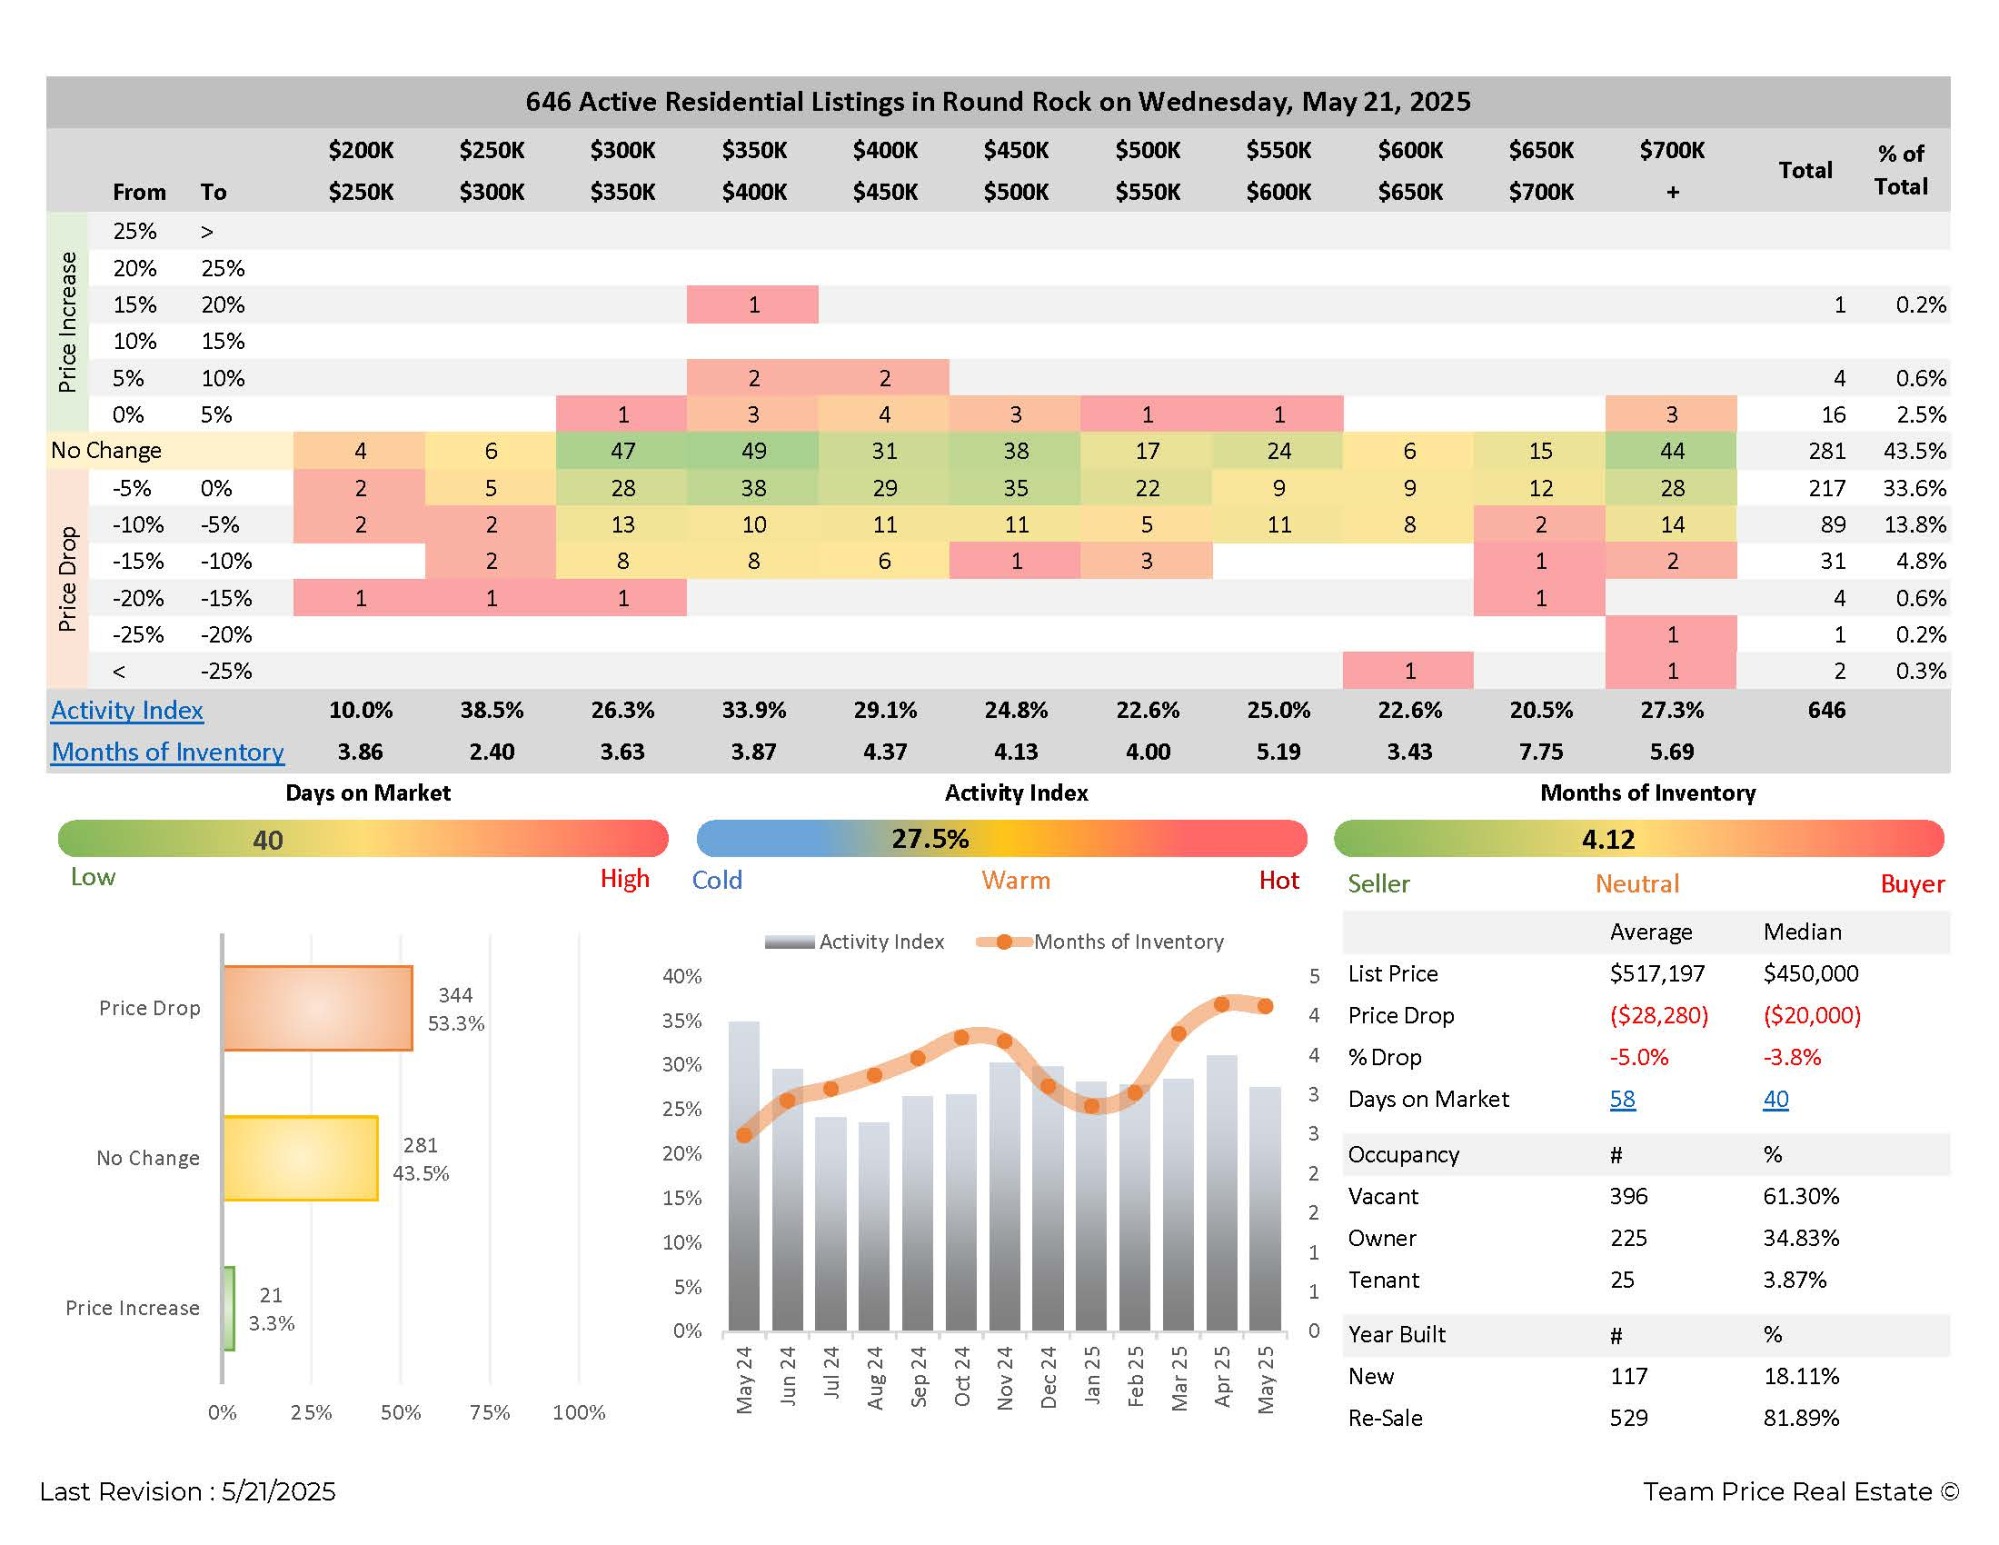
May 21,2025: As of May 21, 2025, the Round Rock residential real estate market had 646 active listings. These homes varied in price, size, and type, reflecting a diverse housing inventory across the city. The average list price was $517,197, while the median list price stood at $450,000, offering options across a wide price spectrum for buyers and sellers alike.
The majority of homes on the market were resale properties, totaling 529 listings or about 81.89% of all active listings. New construction homes made up 117 listings, or 18.11% of the market. In terms of occupancy, vacant homes were the most common, making up 61.30% of listings. Owner-occupied homes accounted for 34.83%, and tenant-occupied listings were limited to just 3.87%.
Price changes were a key feature of the market. A total of 225 homes had experienced a price drop, representing 34.83% of listings. The average price reduction was $28,280, while the median drop was $20,000. These reductions reflect an average percentage decrease of 5.0% and a median of 3.8%. Meanwhile, 281 listings, or 43.5%, showed no price change. Another 140 listings, or 21.7%, had increased in price, highlighting variability in pricing strategies and demand levels.
The distribution of listings across different price brackets provided a clearer picture of the market’s structure. Homes priced between $350K and $450K made up a significant portion of the inventory. The $350K–$400K range included 47 listings, and the $400K–$450K range had 49 listings. Higher price ranges, such as $600K–$650K and $650K–$700K, had smaller shares with 6 and 15 listings, respectively.
Price drops were most concentrated in the -5% to 0% range, with 217 homes, or 33.6%, falling into this category. Another 89 homes (13.8%) saw price reductions between -10% and -5%. Fewer homes, just 31 in total, had price drops larger than -10%. This indicates that sellers are more likely to make modest adjustments rather than significant cuts.
Activity levels varied by price range, based on the Activity Index. The $250K–$300K range had the highest activity index at 38.5%, suggesting stronger buyer engagement. Other active segments included $350K–$400K with a 33.9% index and $300K–$350K at 26.3%. The $600K–$650K segment had the lowest index at 20.5%, pointing to slower movement in higher price brackets.
The overall market held 4.13 months of inventory, a figure that helps define whether a market favors buyers or sellers. A balanced market typically has about 5 to 6 months of inventory. Round Rock’s levels varied by price band. For example, the $250K–$300K range had just 2.40 months of inventory, indicating a seller's market. In contrast, the $600K–$650K range had 7.75 months of inventory, signaling a buyer-friendly environment.
Homes in Round Rock spent an average of 58 days on the market, with a median of 40 days. These figures reflect a market with moderate turnover, where pricing, property type, and location play important roles in how quickly a home sells.
FAQ: Round Rock Housing Market – May 2025
1. Is Round Rock, TX a buyer’s or seller’s market right now?
As of April 2025, Round Rock is transitioning from a seller’s market toward a more balanced one. The rise in active listings—up 41.2% year-over-year to 723 homes—has significantly increased buyer options. Meanwhile, the months of inventory rose from 1.5 to 2.3, still below the 6-month threshold that typically marks a balanced market but indicating a clear shift. Homes are taking longer to sell, with average days on market increasing by 50% to 42 days. Although homes are still selling at 97.3% of their original list price, the pace and pricing trends suggest that buyers now have more negotiating power than they did a year ago. Sellers still have opportunities, but pricing and preparation are now more critical than ever.
2. Are home prices going up or down in Round Rock?
Home prices in Round Rock are showing signs of downward pressure. The median sales price fell by 3.2% compared to the same time last year, coming in at $420,000. However, the average sales price increased by 2.8% to $484,267, which can be attributed to higher-end homes closing despite overall market softening. In contrast, the average list price dropped 6.7% year-over-year to $492,194, and the median list price fell 4.3% to $440,000. This divergence indicates that while some luxury properties are still moving, the overall pricing trend points downward. Sellers are responding to softer demand by lowering list prices to stay competitive.
3. How long are homes staying on the market in Round Rock?
Homes in Round Rock are spending significantly more time on the market than they did last year. The average days on market rose by 50%, increasing from 28 days in April 2024 to 42 days in April 2025. This shift reflects a market where buyers are taking more time to evaluate their options and negotiate. It also signals that sellers may need to be more patient and strategic. Proper pricing, staging, and condition are increasingly important factors to attract attention quickly.
4. Are homes selling below list price in Round Rock?
Yes, the data shows that homes are selling closer to asking price, but with slight concessions. The average percent of original list price received dropped to 97.3%, down from 98.5% the previous year. This means that while homes are not seeing drastic price cuts, sellers are increasingly willing to negotiate. Combined with longer days on market and increased inventory, this suggests that buyers are gaining leverage to make offers below list price and still secure a deal.
5. What are the key trends in the Round Rock housing market for May 2025?
The Round Rock housing market is undergoing notable changes as it adjusts to new supply and demand dynamics. Closed sales fell 12.2% year-over-year to 229 transactions, while pending sales decreased 11.8% to 255, showing reduced buyer urgency. At the same time, active listings jumped 41.2%, increasing options for buyers and competition among sellers. Price trends are mixed, with the median sale price down and average sale price slightly up. New listings dipped 5.3%, suggesting some homeowners are holding off on selling in response to market uncertainty. Overall, the market is becoming more balanced, offering both challenges and opportunities depending on whether you're buying or selling.