• Sign Up
  • Log In
Kristin Stevens
Kristin Stevens
(512) 699-4216kristin@teamprice.com
    • Search
    • Market Report
    • Areas
      • Hutto
      • Fort Hood
      • Buda
      • Bastrop
      • Barton Hills
      • Round Rock
      • Cedar Park
      • Austin
      • Westlake Hills
      • Tarrytown
      • Crestview
      • Downtown Austin
    • Properties
      • Search Properties
      • Featured Properties
    • Insight
    • Market Update
    • Articles
    • News
    • About
      • Meet Kristin Stevens
      • About Team Price
      • Testimonials
    • Contact
    • Kristin Stevens(512) 699-4216
      kristin@teamprice.com
      Copy Email
    • Team Price Real Estate
      7320 N Mo-Pac
      Austin, TX 78731
      (512) 213-0213
      dan@teamprice.com

    Search

    • Search Properties
    • By City
    • By Subdivision
    • By Zip

    Explore

    • Featured Properties
    • Areas
    • Property Search

    Company

    • Guarantee
    • Work with Us
    • Interview Questions
    • Join Our Team

    Resources

    • Insight and Statistics
    • Tenant Pre-Screening
    • Real Estate Forms
    • Real Estate Glossary

    About

    • Home
    • About
    • Agents
    • Testimonials
    • Contact Us

    Account

    • Login
    • Sign Up
    Kristin Stevens - Footer Logo
    • Texas Real Estate Commission Information About Brokerage Services
    • Texas Real Estate Commission Consumer Protection Notice
    • Privacy
    • Terms
    • DMCA
    • Accessibility
    • Fair Housing
    © 2025 Team Price Real Estate. All rights reserved.
    Website built by CloseHack.
    Central Texas Multiple Listing Service

    Central Texas MLS | Four Rivers Association of REALTORS® All information deemed reliable but not guaranteed. All properties are subject to prior sale, change or withdrawal. Neither listing broker(s) or information provider(s) shall be responsible for any typographical errors, misinformation, misprints and shall be held totally harmless. Listing(s) information is provided for consumer's personal, non-commercial use and may not be used for any purpose other than to identify prospective properties consumers may be interested in purchasing. The data relating to real estate for sale on this website comes in part from the Internet Data Exchange program of the Multiple Listing Service. Real estate listings held by brokerage firms other than Kristin Stevens may be marked with the Internet Data Exchange logo and detailed information about those properties will include the name of the listing broker(s) when required by the MLS. Copyright ©2022 All rights reserved.

    Austin Board of Realtors

    The information being provided is for consumers' personal, non-commercial use and may not be used for any purpose other than to identify prospective properties consumers may be interested in purchasing. Based on information from the Austin Board of REALTORS®. Neither the Board nor ACTRIS guarantees or is in any way responsible for its accuracy. All data is provided "AS IS" and with all faults. Data maintained by the Board or ACTRIS may not reflect all real estate activity in the market.

    • MLSGrid IDX Data Notice
    • DMCA Notice
    Leander Housing Market Report: May 2025 Sees High Inventory and Price Reductions

    Leander Housing Market Report: May 2025 Sees High Inventory and Price Reductions

    Published 05/30/2025 | Posted by Kristin Stevens

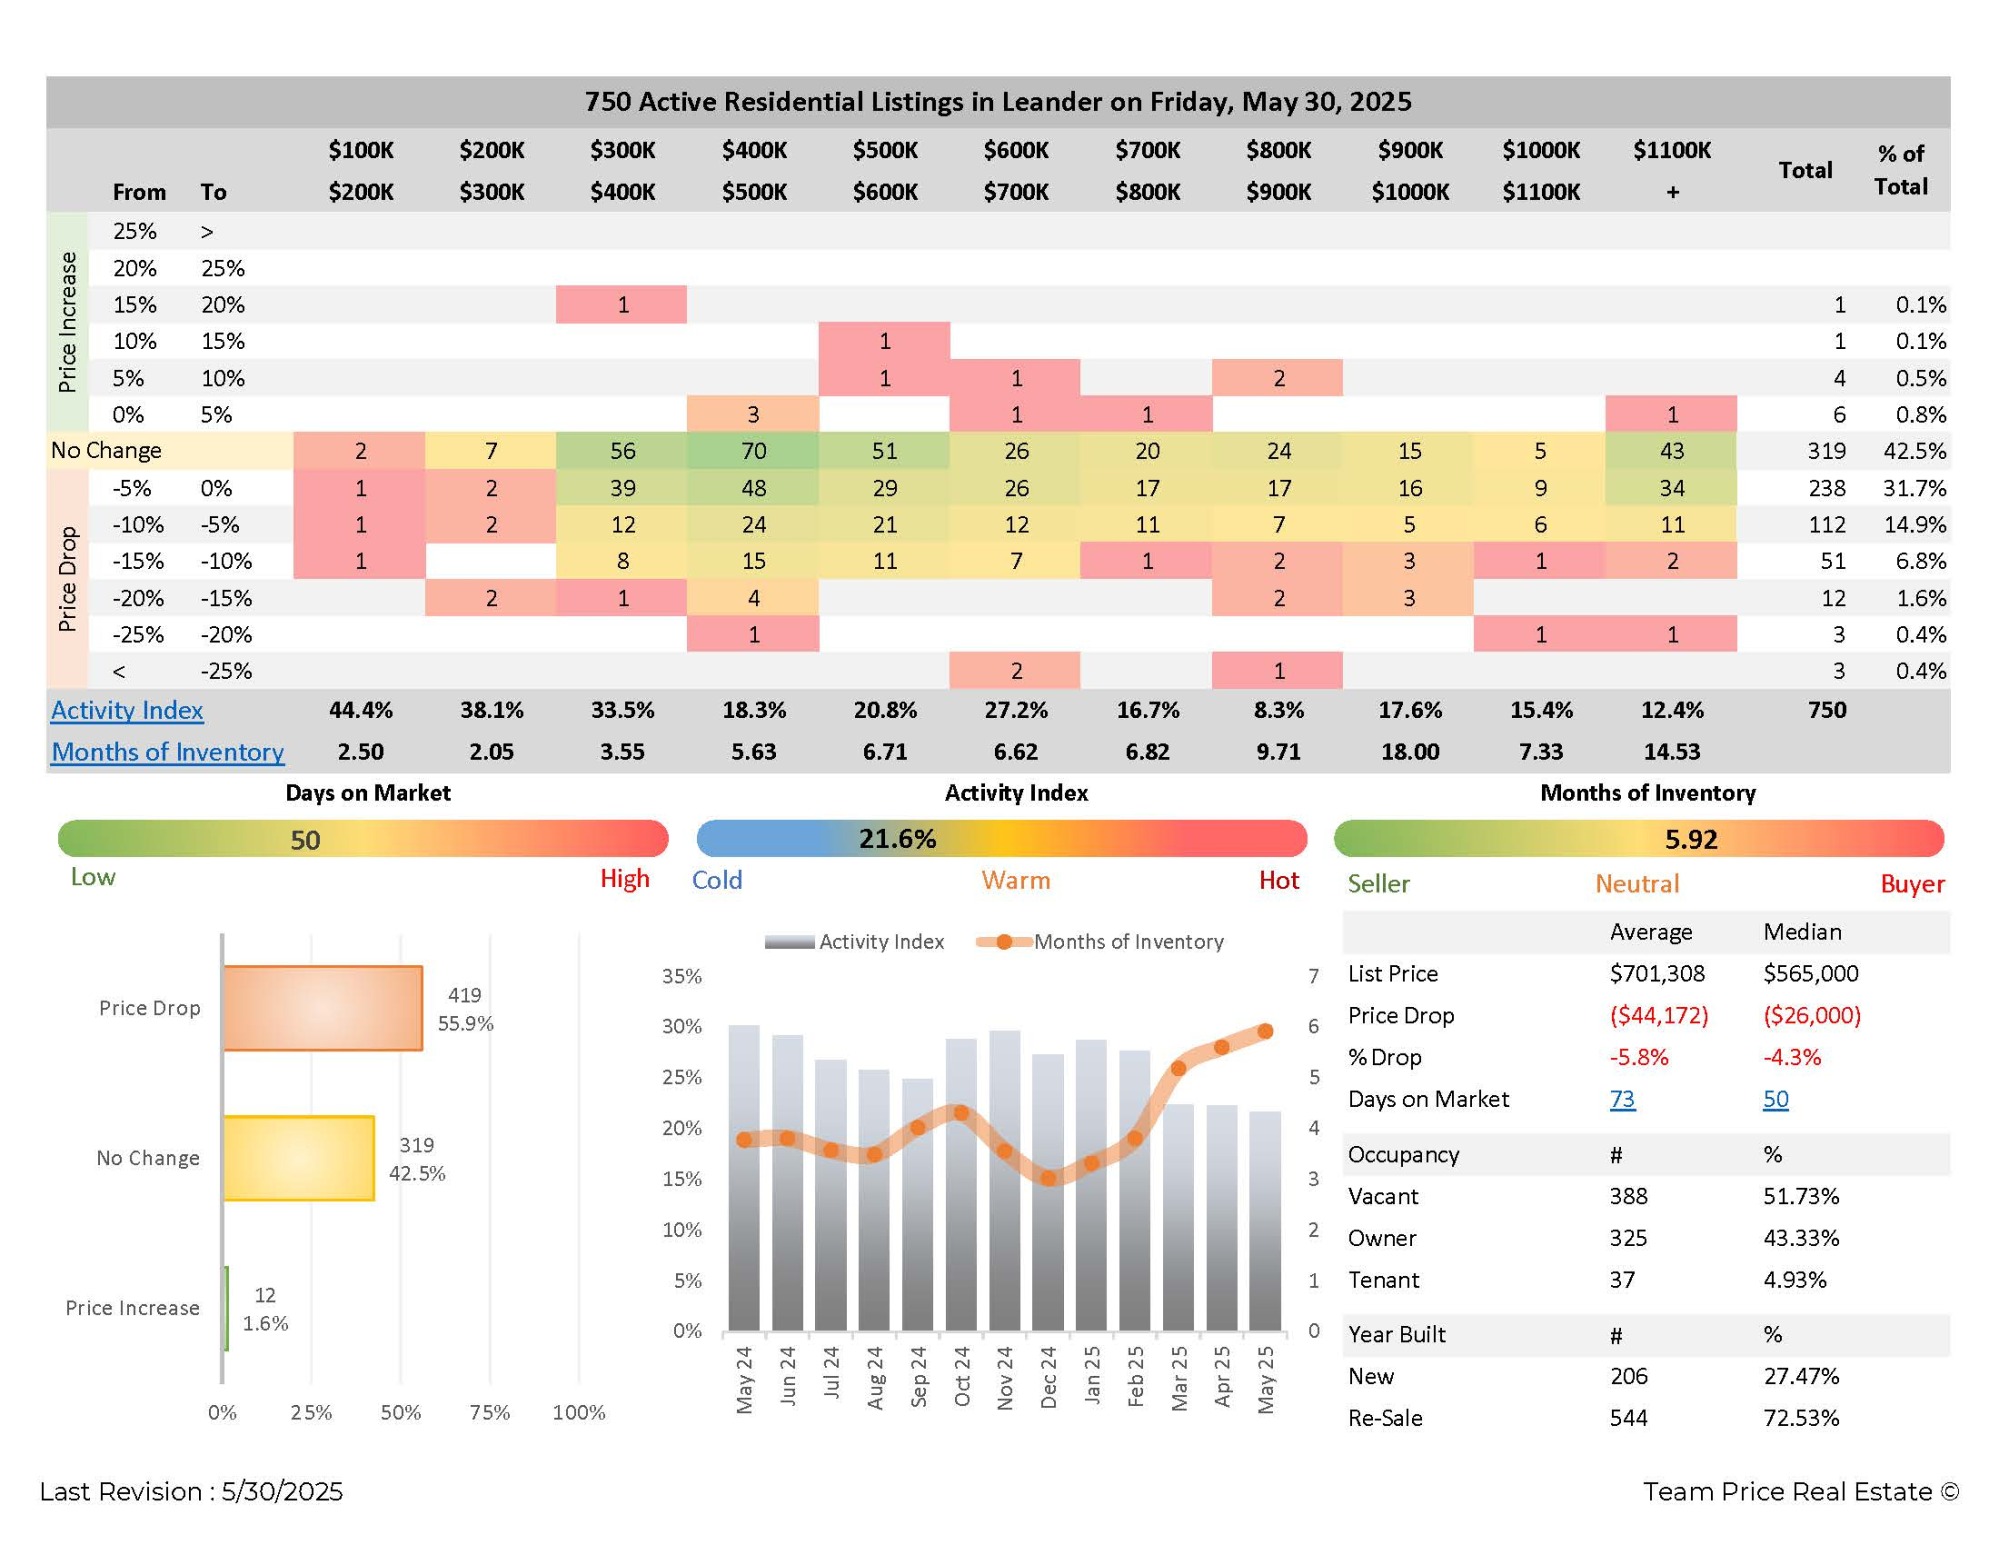
    May 30,2025: The Leander real estate market in May 2025 showed signs of slowing, with many homes seeing price reductions and longer selling times. As of May 30, there were 750 active residential listings in Leander. Of those, 72.53% were resale properties and 27.47% were new construction. In terms of occupancy, 51.73% of homes were vacant, 43.33% were owner-occupied, and 4.93% were tenant-occupied.

    ​

    The average list price for active homes in Leander was $701,308, while the median price stood at $565,000. Out of the 750 listings, 319 homes had a price drop, making up 42.5% of the total market. Only 12 listings, or 1.6%, saw a price increase. Most homes—55.9%—did not change their list price. The average price reduction was $44,172, and the median drop was $26,000. This results in an average price drop of 5.8% and a median drop of 4.3%.

    ​

    Homes also took longer to sell in May. The average number of days on market was 73, with the median at 50 days. This suggests that while some homes are still moving, the market pace has slowed, especially in higher price ranges or less competitive segments.

    ​

    Buyer demand was strongest in the lower to mid-price ranges. The Activity Index for homes priced between $200K and $300K was the highest at 44.4%. The $300K to $400K and $400K to $500K ranges followed with activity levels of 38.1% and 33.5%. Activity dropped in higher brackets, falling to just 8.3% in the $900K to $1M range and 12.4% in the $1M to $1.1M range. These trends suggest more interest in affordable homes while higher-end properties are moving more slowly.

    ​

    Inventory levels also varied across price points. The overall months of inventory was 5.92, indicating a more neutral market, but conditions differed significantly by price range. The most competitive markets were in the $200K to $400K range, with just 2 to 2.5 months of inventory. Higher-end homes, such as those priced between $900K and $1M, had as much as 18 months of inventory, showing a much slower pace of sales.

    ​

    Price reductions were also more common in the mid-price ranges. Nearly 32% of listings had price drops between 0% and 5%, and another 15% saw reductions between 5% and 10%. Around 7% had price cuts between 10% and 15%, and a small portion of homes reduced prices by more than 15%.

    ​

    In summary, the Leander housing market in May 2025 is marked by high inventory, frequent price reductions, and a shift in buyer focus toward more affordable homes. With slower sales and limited activity in luxury price points, the market is adjusting to evolving buyer behavior and pricing expectations.


    ​1. What is the real estate market like in Leander, TX as of May 2025?​

    Leander had 750 active listings in May 2025. Most were resale homes, and 42.5% of listings had price drops. Homes averaged 73 days on market, and inventory levels suggest a neutral-to-buyer-leaning market.

    ​

    2. How much have home prices dropped in Leander in May 2025?

    The average price drop was $44,172 (5.8%), and the median drop was $26,000 (4.3%). Nearly half of all listings reduced their asking prices.

    ​

    3. Which price ranges have the most buyer activity in Leander?

    Homes priced between $200K–$500K had the most demand, with activity index levels of 33% to 44%. Buyer activity dropped significantly above $700K.

    ​

    4. How long are homes taking to sell in Leander in May 2025?

    The average days on market was 73, with a median of 50. Homes are selling slower than previous months, especially in higher price brackets.

    ​

    ​5. Is Leander a buyer’s or seller’s market in May 2025?

    With 5.92 months of inventory, longer market times, and broad price reductions, Leander is trending toward a buyer-favored market, especially in luxury price ranges.

    • Leander housing market
    • Leander real estate
    • May 2025 housing report
    • Leander home prices
    • Leander real estate trends
    • Leander TX listings
    • Leander price reductions
    • homes for sale Leander
    • Leander days on market
    • Leander inventory levels
    • Leander buyer activity
    • Leander average list price
    • Leander resale homes
    • Leander new construction
    • Leander market update

    Related Articles

    Keep reading other bits of knowledge from our team.

      Request Info

      Have a question about this article or want to learn more?